Download Free Template Here:Steam Traffic Formula (Google Spreadsheet)
How Much Steam Traffic You Need If Your Goal Is $50,000 Game Sales: Simple Formula
In one minute, you're about to learn a very simple formula to help you find out how much traffic your Steam page needs to reach your financial goals.
And to make it even easier, I've created a template where you can plug in your numbers and it automatically calculates it for you.
So open this template: Steam Traffic Formula (Google Spreadsheet), and follow along. To download: File -> Download -> Microsoft Excel. Then open the excel file in Google Sheet (or MS Excel).
Also, I recommend you open the template in a separate browser window so you can split screen this article with the template. Like so...
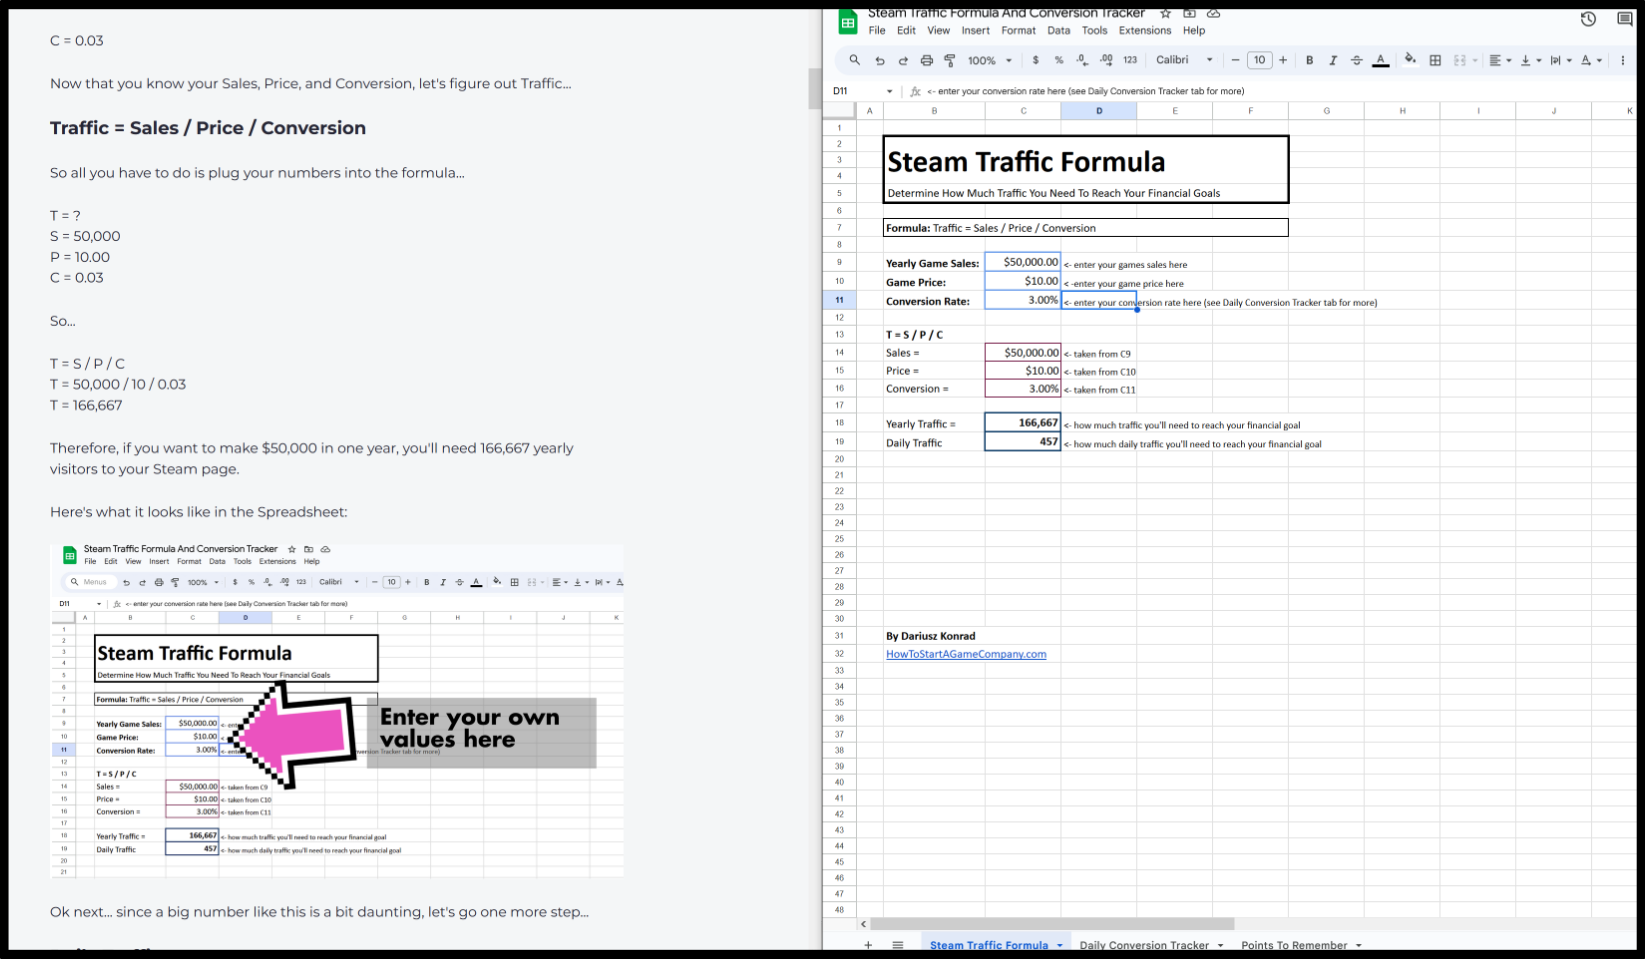
Got the split screen going? Great.
Ok, here's the formula, and here's how it works...
The "Steam Traffic Formula" Template
The formula goes like this:
Traffic = Sales / Price / Conversion
Or...
T = S / P / C
So let me show you exactly what to do...
S = Sales
First, start with the end in mind. How much do you want to make this year in game sales? In my example, I'm using $50,000. So...
S = 50,000
P = Price
Then you need to know your game price. If you don't, that's ok. You can estimate and use a "ballpark" figure. I'm going to use $10.00. So...
P = 10.00
C = Conversion
Next, you'll need to plug in your conversion rate. A conversion rate is when, let's say 100 people visit your Steam Store page. And 3 people out 100 buy your game. So your conversion is 3% (3 / 100 = 0.03 or 3%).
And don't get me wrong... a 3% conversion rate is really good. In fact, it's not that easy to get a 3% conversion rate. Later on I'll show you how you can improve your conversion rate. But for this example, I'm going to use 3%. So...
C = 0.03
Now that you know your Sales, Price, and Conversion, let's figure out Traffic...
Traffic = Sales / Price / Conversion
So all you have to do is plug your numbers into the formula...
T = ?
S = 50,000
P = 10.00
C = 0.03
So...
T = S / P / C
T = 50,000 / 10 / 0.03
T = 166,667
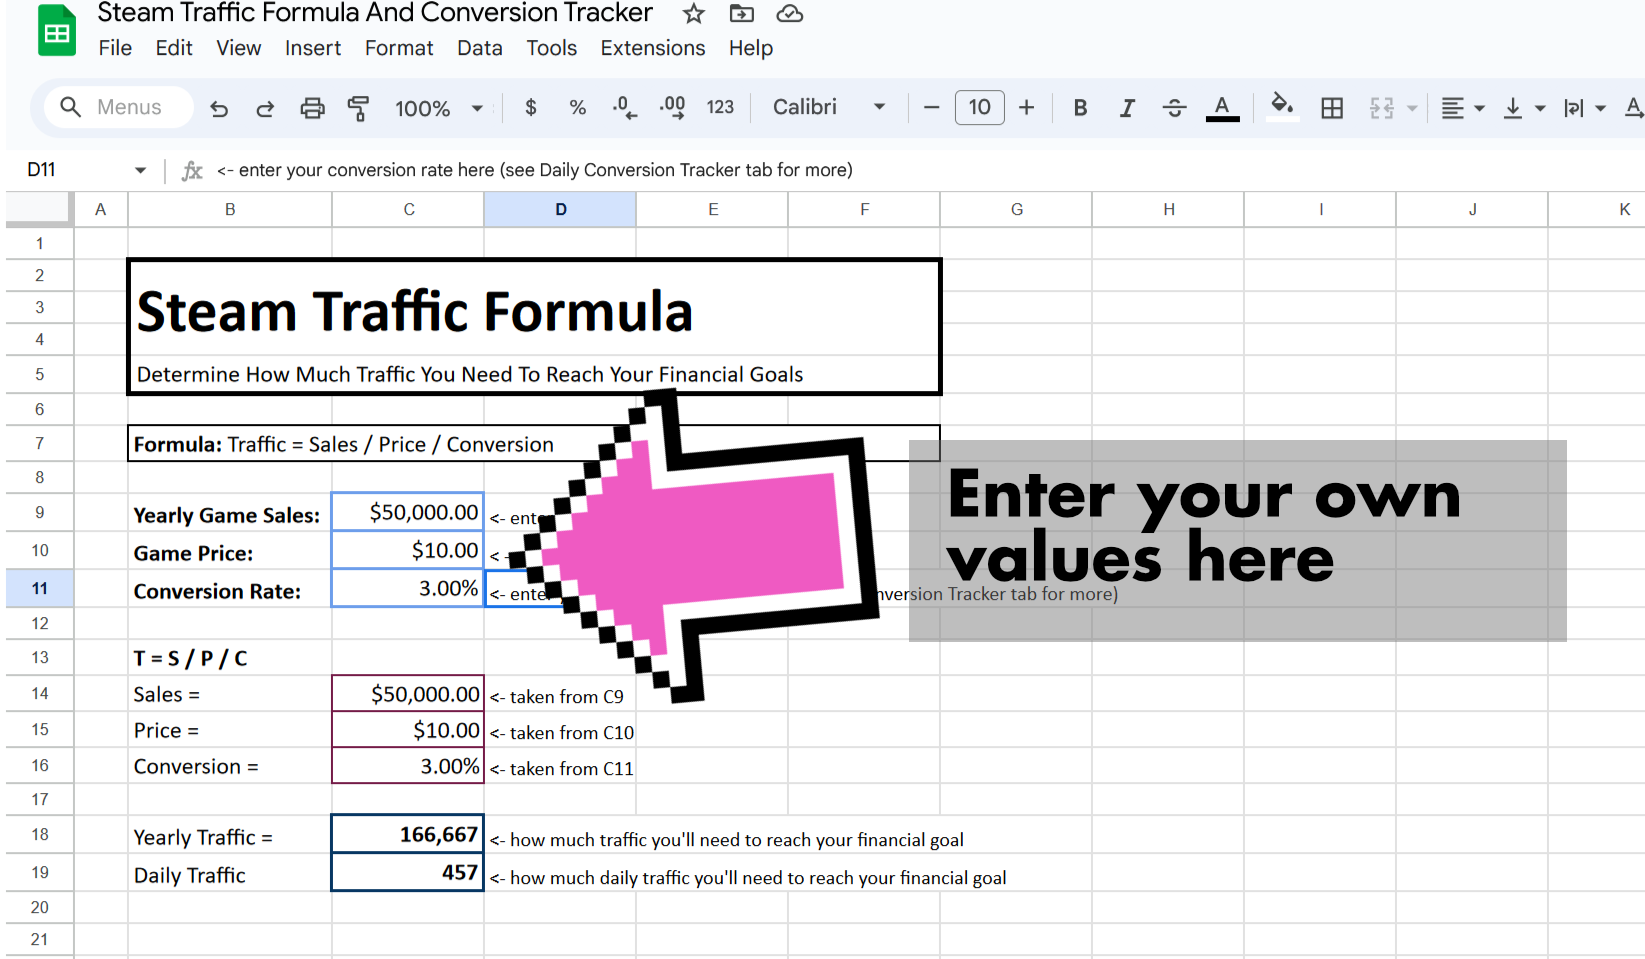
Therefore, if you want to make $50,000 in one year, you'll need 166,667 yearly visitors to your Steam page.
Here's what it looks like in the Spreadsheet:
Ok next... since a big number like this is a bit daunting, let's go one more step...
Daily Traffic
To make it more clear in your brain and less daunting, let's find out how much daily traffic you need.
So to do that, let's take the value of T and divide it by 365.
So...
Daily Traffic = T / 365
So in my case:
Daily Traffic = 166,667 / 365
Daily Traffic = 457
So I'll need 457 daily visitors to my Steam Store page if my goal is to make $50,000 game sales in one year.
Ok, that's great... but what if you only have 10 daily visitors and your conversion is 0.01%?
How do you increase your traffic? How do you reach a 3% conversion?
Well, let's use this data to help you increase traffic and improve your conversion rate. Here's how...
How To Use This Formula To Help You Increase Traffic And Improve Your Conversion
When you first start your game company, it's easy to keep basic stats in your head. But at some point you can't keep all this data about your game studio in your head. You'll need to build a system where all of this info isn't floating around in your brain.
You see, growing your game company doesn't happen by accident. Yes, you can work hard everyday and push yourself and hussle, and hope you get more traffic and get a good conversion rate.
But the reality is, a game company will never grow unless the game dev turns what's in their head into a process that they can test and measure.
We need to take what's in our brain and create an instrument called a "Business System". Why? Because we don't want to make business decisions based on assumptions... we want to make business decisions based on what the data shows.
So what I mean is, once you know that you need, say, 457 daily visitors and you need to reach a 3% conversion, then now you have a concrete goal. Now you know exactly where you need to go.
And now you can start measuring your actions and efforts to see if you're getting closer to your goals -- or away.
But if we don't create a business system, then all we have is our assumptions. And often what we assume is going on is NOT what is really going on. And we never know if our actions are getting us closer to our goals or not.
Let me show you a concrete example...
Say you post videos about your game on TikTok and YouTube. And you notice that TikTok gets more views than YouTube.
So intuitively, in your head, you would assume that most of your traffic to your Steam page comes from TikTok.
But in business, success is counter-intuitive. Results are often counter-intuitive. And we can't assume things. We need to take what's in our head and test our assumptions against what's really happening in the real world.
We need data to tell us what's actually happening -- because often what we THINK is happening is NOT happening.
Anyway, back to my example...
So let's say TikTok gets more views than YouTube. But now you know that you need to test your assumptions in real life to be sure what you think is going on is actually going on.
So you decide to test which drives more traffic. So using Steam's tracking tools you find out how much traffic you're getting from TikTok and from YouTube.
By the way... you probably know this, but Steam has two amazing resources to help you track your traffic:
Steam's UTM Analytics Tool
Steam's Traffic Reporting Tool
Ok, back to my example...
So after running a test, and getting results, you find out that even though TikTok gets more views, YouTube is the one that drives 80% of traffic to your Steam page.
This is just an example. For some games TikTok works. For some it doesn't. The point is... you need to test your assumptions. Just because one game dev said it worked for them, doesn't mean it'll work for you. Or it might. But you need to test.
But if you haven't done this test, then yeah, you would assume that since TikTok gets more views, then it drives more traffic. But your assumption would be wrong. And now you are allocating time and resources into actions that are not working -- and worst of all you have no idea that it's not working.
Testing will often shatter your assumptions.
So we need to test all our assumptions because what seems intuitive is often wrong. What seems to work in our "head" often doesn't work in real life.
Again, that's because business success is often counter-intuitive. And the only way to discover new insights is to track and test.
Ok... let's keep going and setup your own "Business System" so that you can use this system to help you discover ways you can increase traffic and improve your conversion rate.
And the best part is, I've done almost all the work for you. All you have to do is plug in your numbers, and the "Business System" does all the math for you.
So lets stop hoping that your game studio grows. Let's use data to help you increase your traffic to your Steam store page, and improve your conversion rate.
Here's how...
How To Use The "Steam Traffic Formula" To Help You Reach Your Financial Goals
The "Steam Traffic Formula" Spreadsheet has THREE tabs:
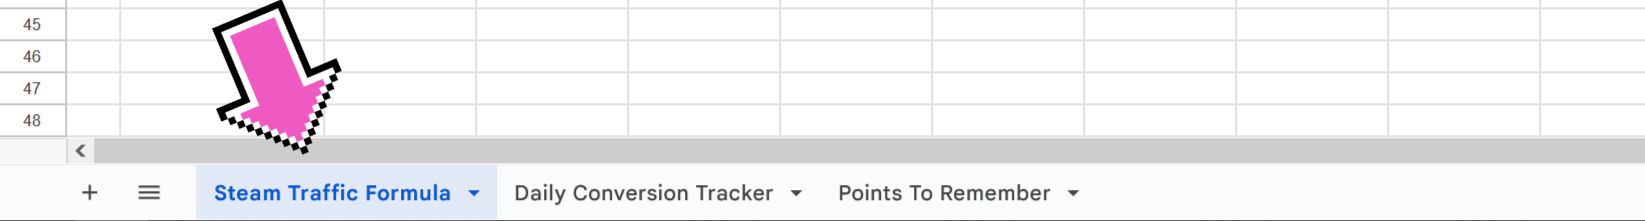
Tab #1: Steam Traffic Formula. This tab calculates how much traffic you need to reach your financial goals (I just showed you this).
Tab #2: Daily Conversion Tracker. This tab will help you determine your ACTUAL conversion rate, and help you figure out what marketing efforts are working or not. Again you don't want to rely on assumptions. You want to test your assumptions and discover what is really working.
Tab #3: Points To Remember. This tab explains some key takeaways you need to know while you're testing and tracking your efforts.
Ok, I already showed you the first tab, Steam Traffic Formula. So let's move on to the next tab...
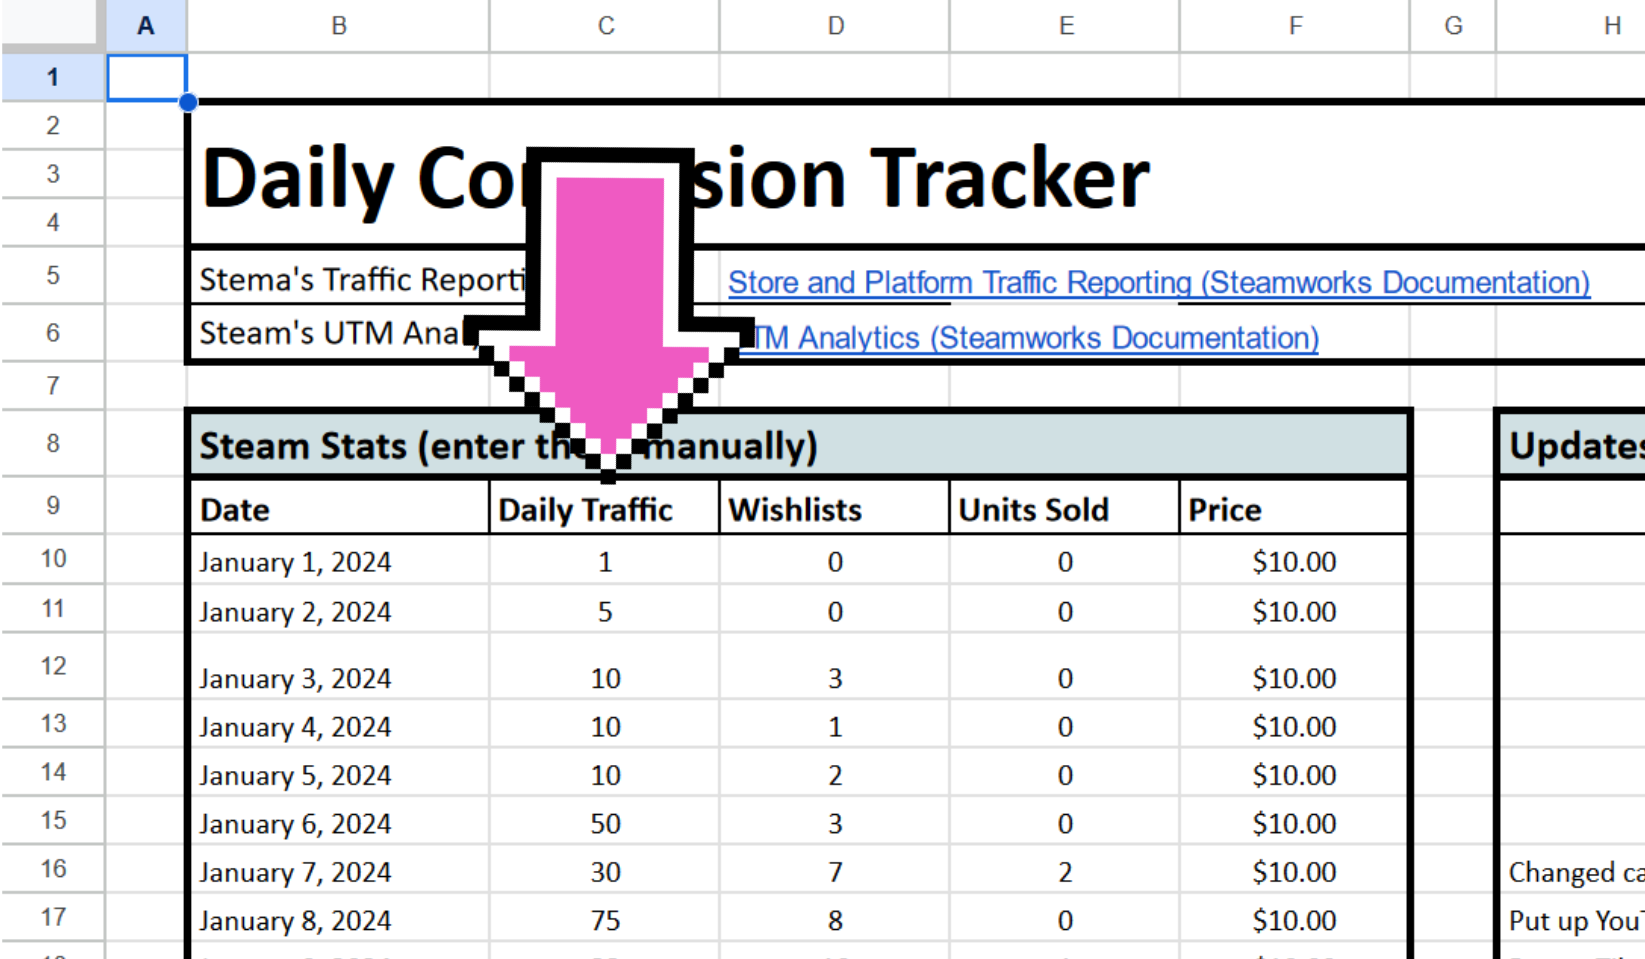
The Daily Conversion Tracker (Tab #2)
Remember, you can HOPE that your game studio grows. Or you can setup up systems that helps you monitor what you're doing is working or isn't working. You want to deliberately create a "business system" so that you have an instrument that helps you increase traffic and improves your sales conversion.
So if you remember, I need 457 daily visitors if I want to reach my goal of $50,000 in game sales a year. Also, I need my conversion rate to be 3%.
Now here's how to use this data to reach your financial goals...
So to do that, let's go into the the second tab, Daily Conversion Tracker. Click that, and you'll notice that you'll be tracking the following vital stats:
- Daily Traffic
- Wishlists
- Units Sold
- Price
Also, one more very important section is your where you track all your efforts (i.e. updates, video posts, social media posts, price changes, changes to your Steam page, etc.).
Anyway, let's go more in-depth on how all of this works...
Column B10: Date
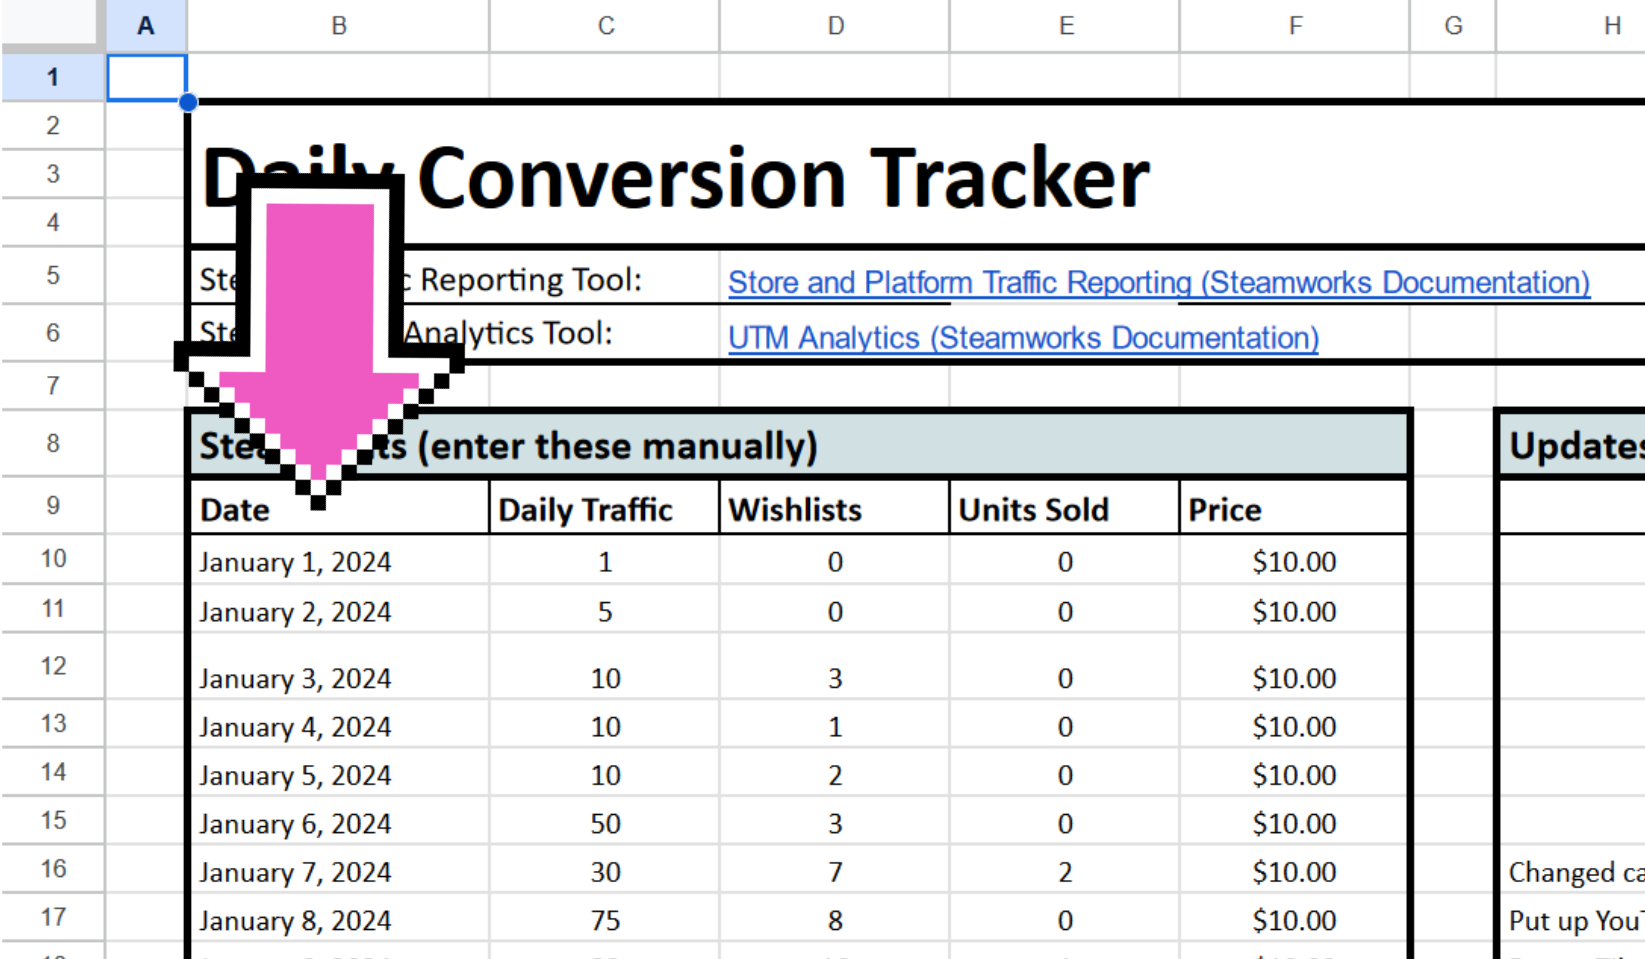
From here on down, enter the date. For simplicity, I'm starting from January 1, 2024 and going to December 31, 2024 -- a full year. But your date can start at your game launch date. Or it can start at your fiscal year.
Column C10: Daily Traffic
This is where you'll enter your daily Steam traffic.
And remember, you can get these stats from Steam's tracking tools:
Steam's UTM Analytics Tool
Steam's Traffic Reporting Tool
Column D10: Wishlists
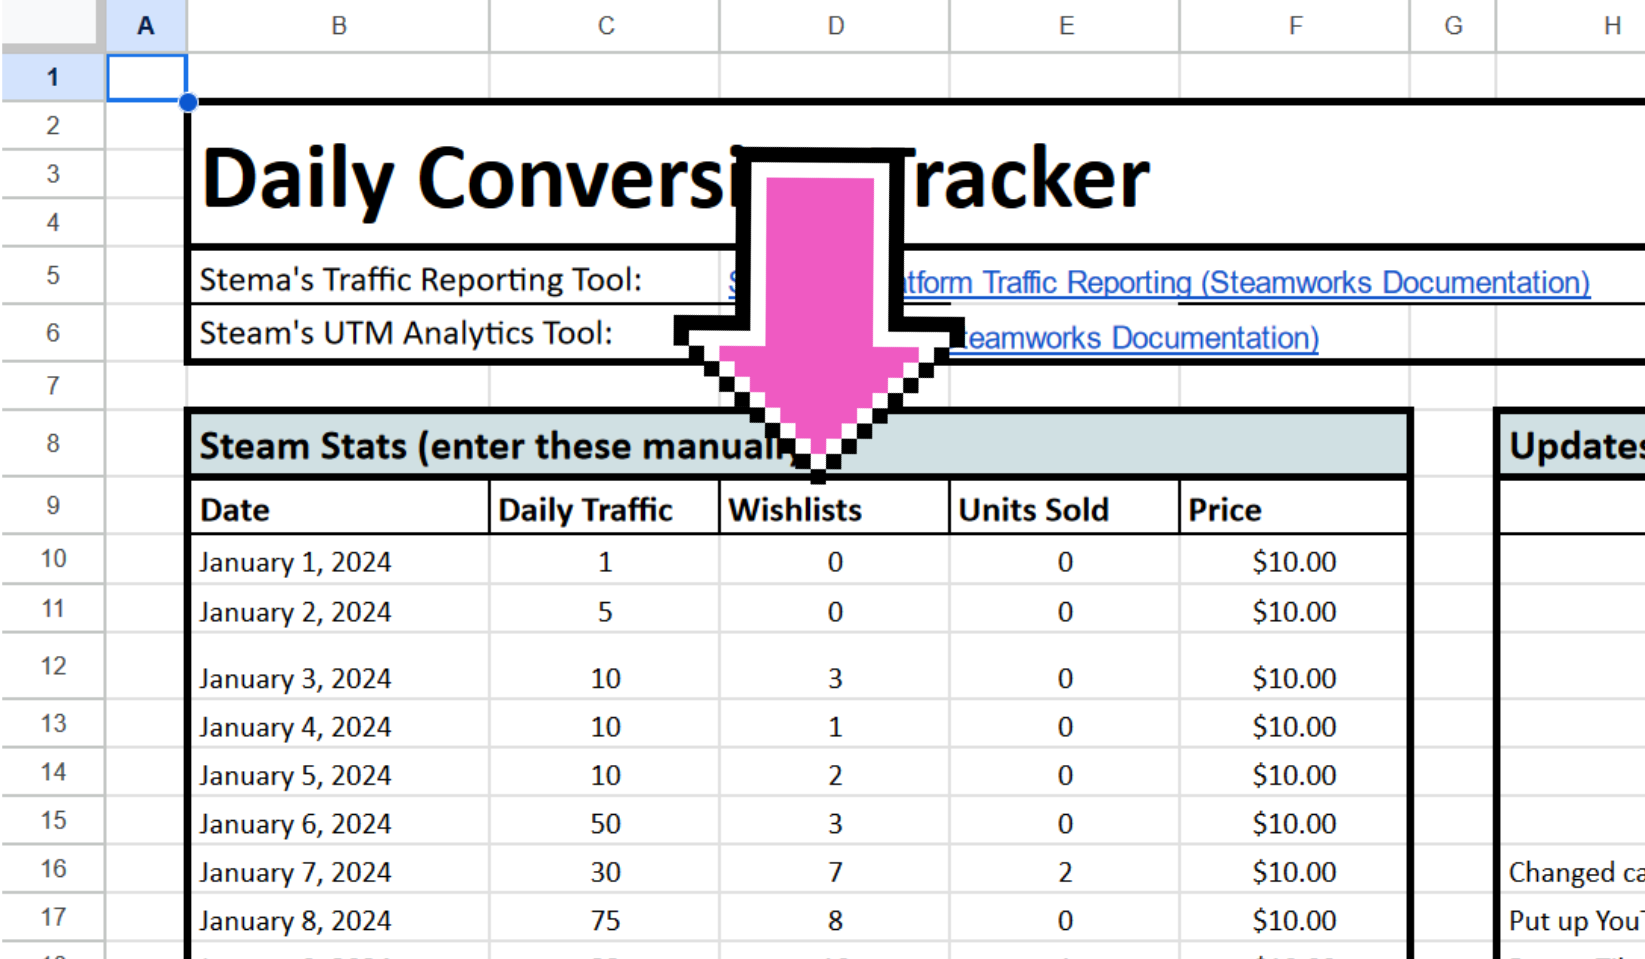
Enter your wishlists for that day using Steam's tracking tools.
Column E10: Units Sold
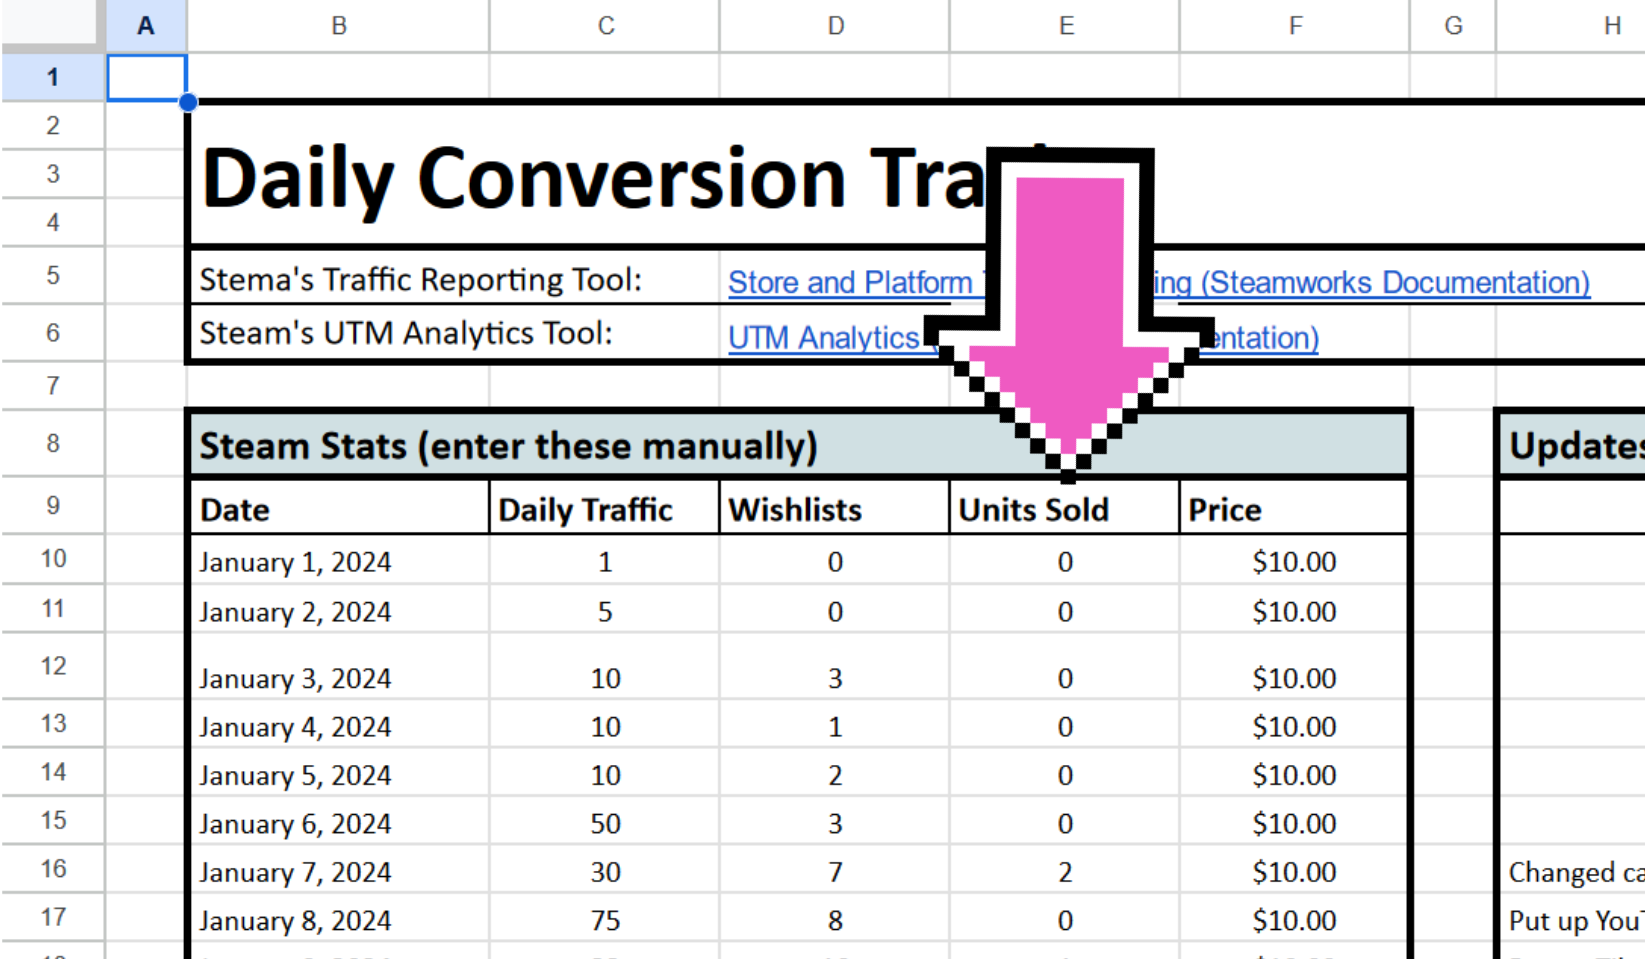
Enter how many units you sold that day using Steam's tracking tools.
Column F10: Price
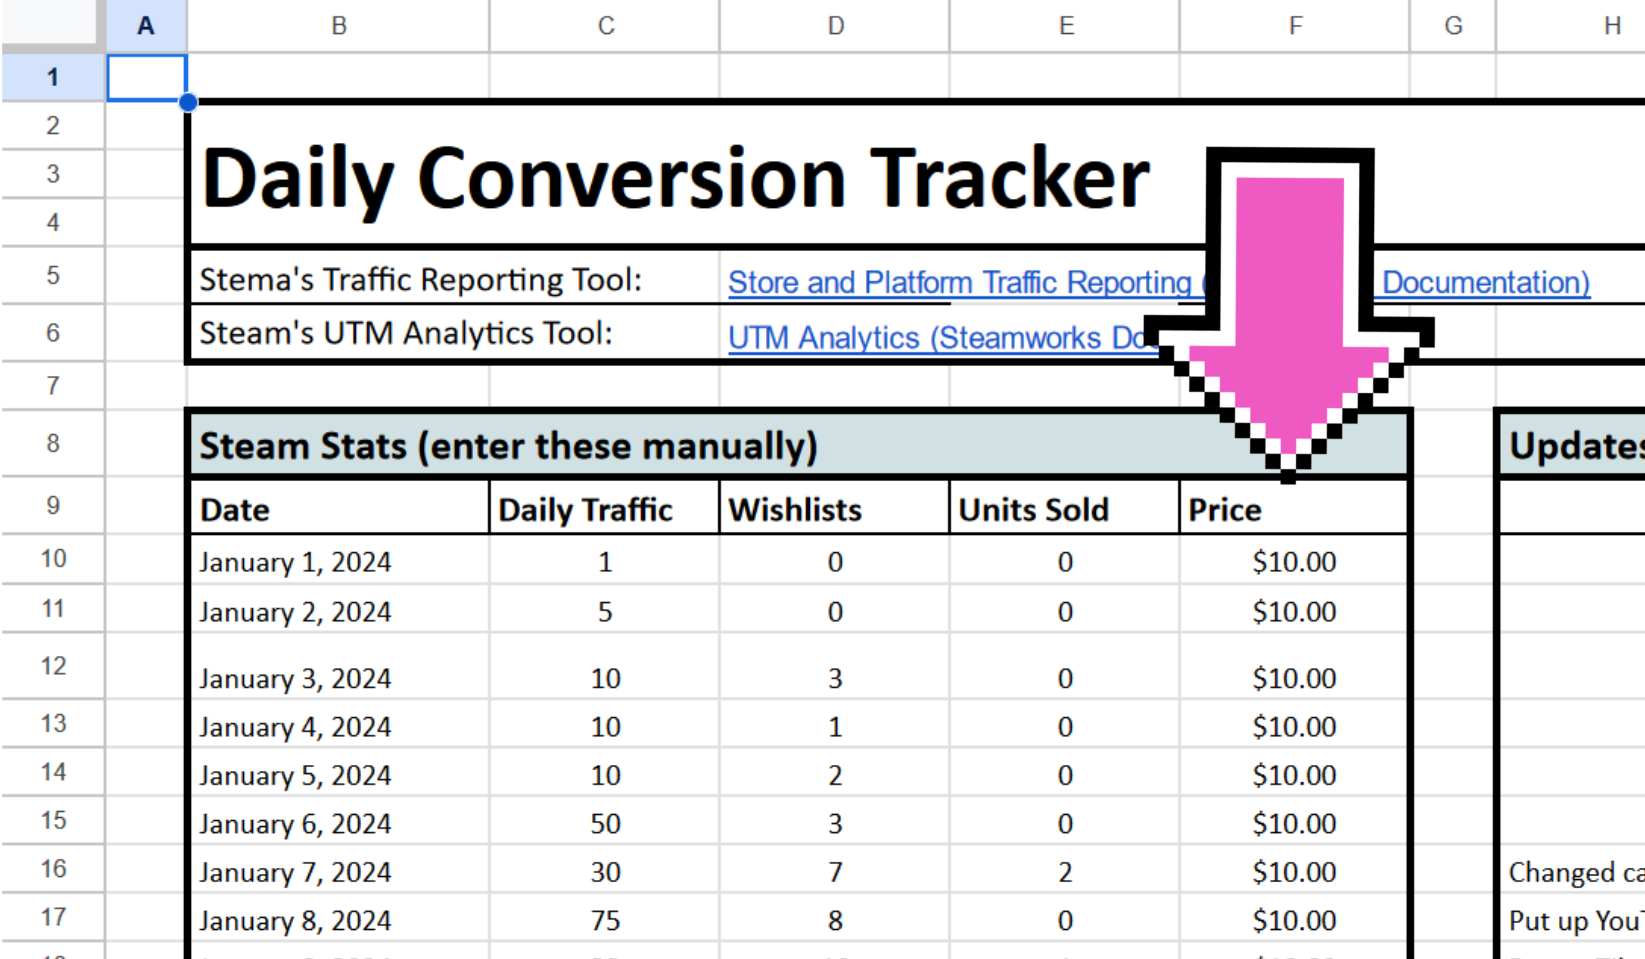
Enter the current price of your game. This may stay the same for a while, but remember you'll often participate in Steam sales. And you'll also want to test pricing. So your price will change during the year.
Also remember, business is counter-intuitive: There have been times when I've raised my price and got more sales. So track your game's price because it'll help you dial-in the best price for your game.
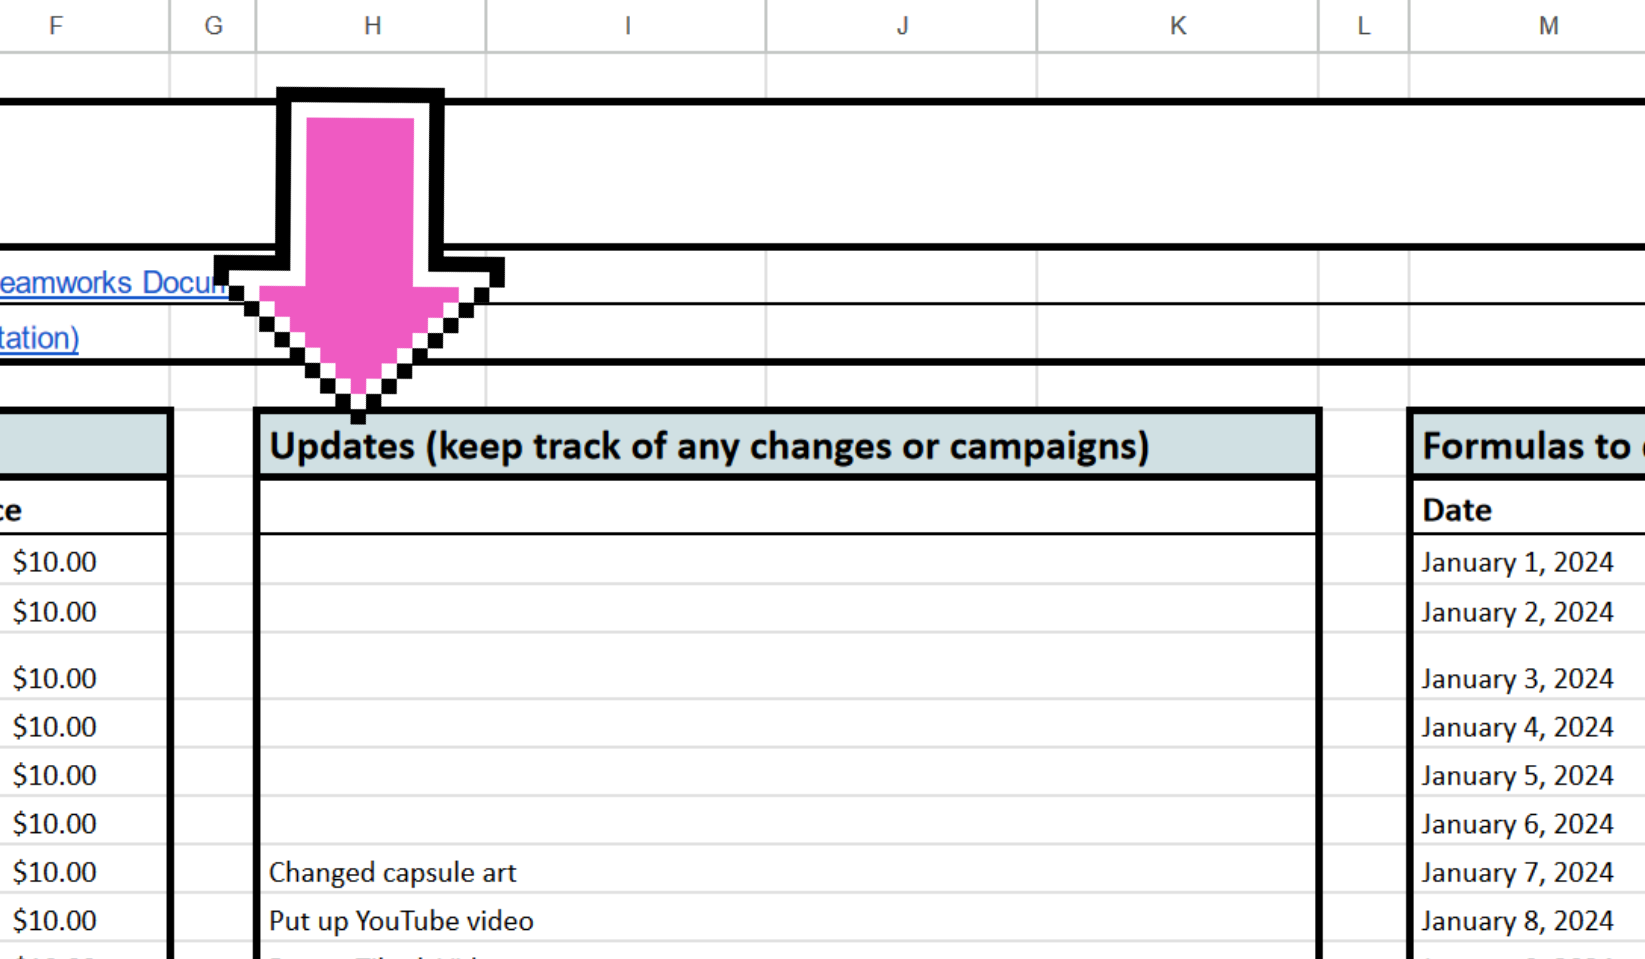
Column H10: Updates
Ok, this section is the most important part of everything...
H10 and down, you'll keep track of any of the actions you take (i.e. updates, changes, campaigns, video uploads, changes to your Steam page, etc.).
It's important to note your daily actions and activities so that if there is a spike in wishlists or sales, then you'll know what caused it. Knowing this will help you optimize your efforts.
For example you want to find out which drives more traffic: TikTok or YouTube.
So instead of measuring your success by looking at likes, comments, subscribers, or views... you measure the performance of each platform in terms of Steam page traffic.
Because it doesn't matter if your TikTok videos got 10,000 views if only 93 people visited your Steam page. What matters is did the video drive traffic to your Steam page or not? It's not about "exposure".
Some will tell me that this is good for branding -- that 10,000 views is amazing, no matter if it only got you 93 Steam page visits. And they will tell me that a person needs to see your stuff "seven times" before they decide to buy.
But in my business experience, most people will only see your stuff ONE time. You only have one chance to grab their attention and get them motivated enough to visit your Steam page.
I say this because small and medium-sized game studios don't have millions to spend on branding and get their "name out there" and expose their game multiple times to a single person.
So remember, most players will see your stuff once. You only have a single chance to grab their attention.
So keep track of your efforts because you'll discover what works in terms of getting attention and what doesn't. You want to optimize your marketing efforts because you only have one shot at this.
And remember... most of your efforts won't work. Most of the marketing you put out there won't grab attention.
But by tracking your efforts and watching the numbers, you'll discover those actions that do work.
THIS is how you improve your traffic. By taking action, getting feedback, analyzing the numbers, and refining things -- this is how to optimize your efforts and increase your traffic.
But what most game devs do is they just basically start posting wherever and whenever. They have no idea what is working or not. They assume that as long as they're getting "exposure", then that will eventually turn into traffic.
Or they just hope Steam will give them organic traffic.
But that's not how to take your game company to the next level. We need to watch carefully what works and what doesn't.
This is important because you only have so much time in the day. If you're wasting 80% of your effort and getting 20% of the results, then your game studio won't grow.
The idea here is to find those 20% activities in your business that get 80% of the results. Find those activities that generate 80% of the results, and put more time and resources into developing those.
All right... let's move on now to the next part. And in these parts, you don't have to enter anything manually. The rest of it is all calculated for you...
So let me show you...
Column N10: Sales That Day
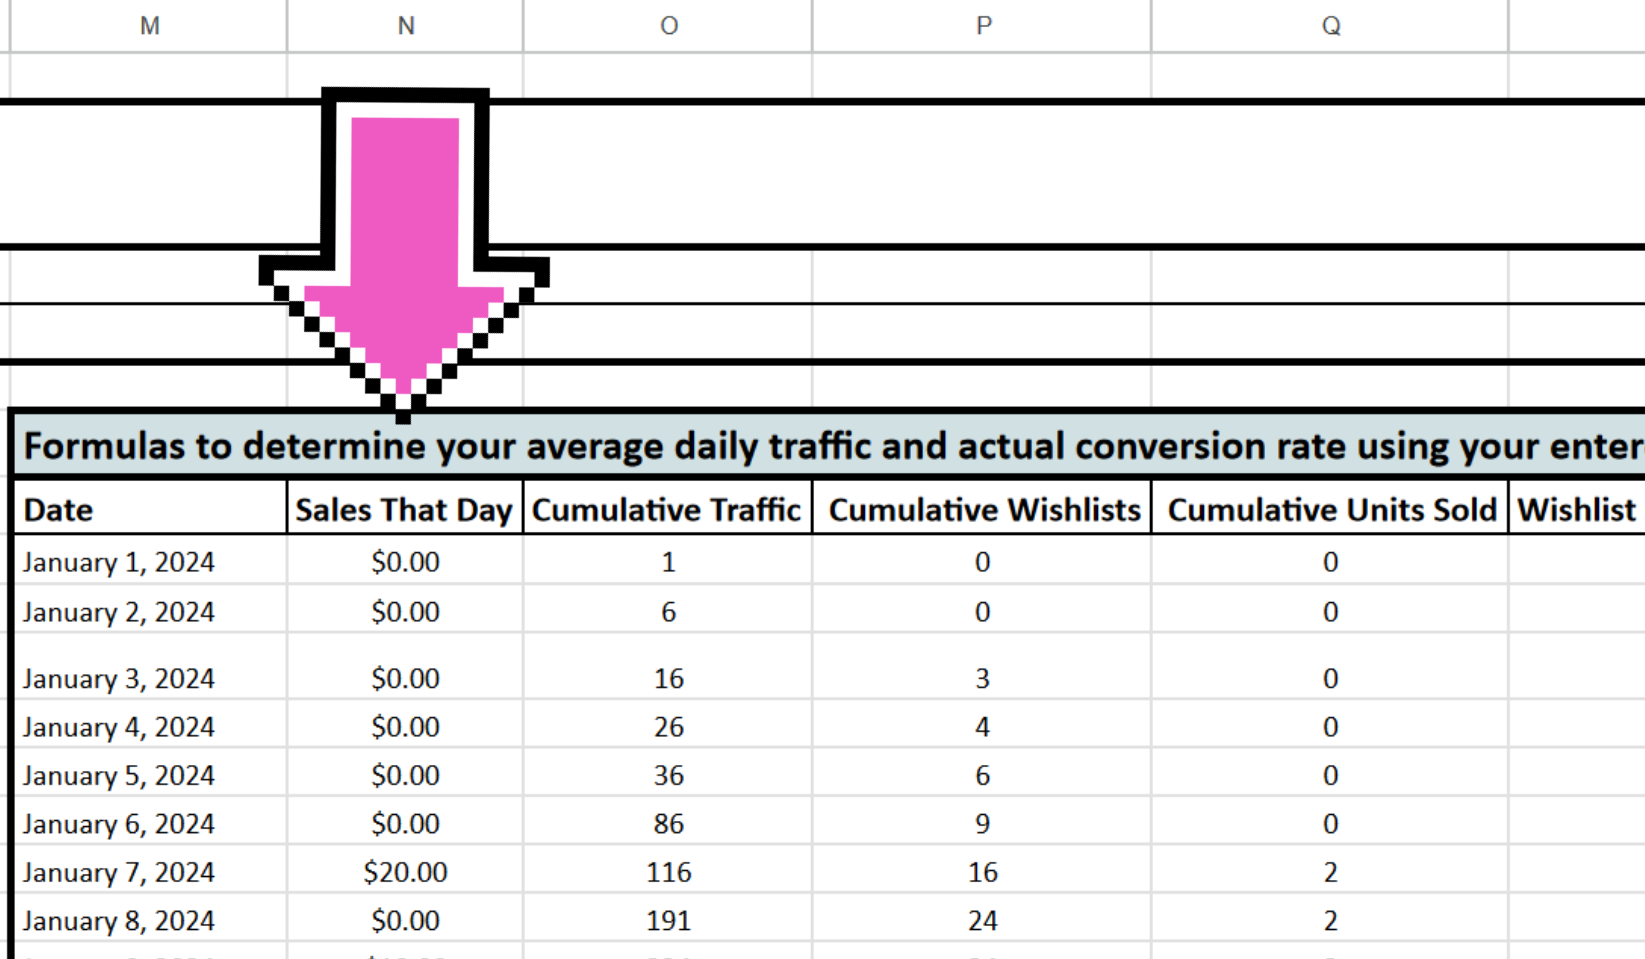
This is your sales for that particular date.
Column O10: Cumulative Traffic
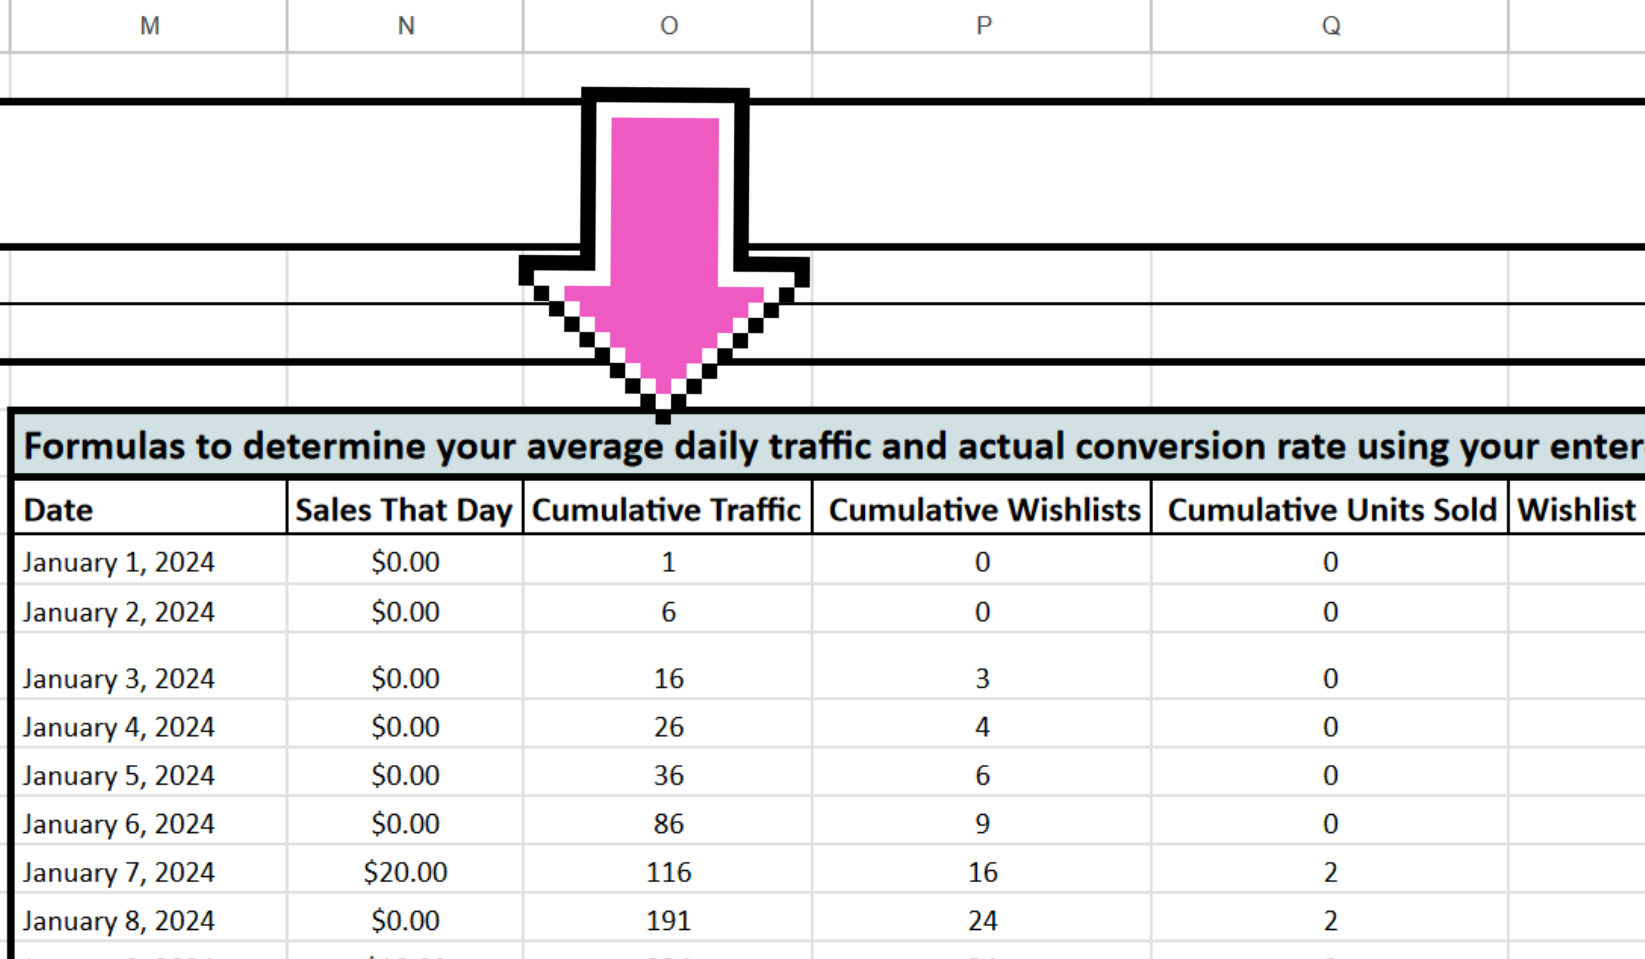
This is the cumulative traffic you have up to a certain date. I'm using an array formula to calculate your daily cumulative traffic. And I'll use this number to determine your actual conversion rate.
Column P10: Cumulative Wishlists
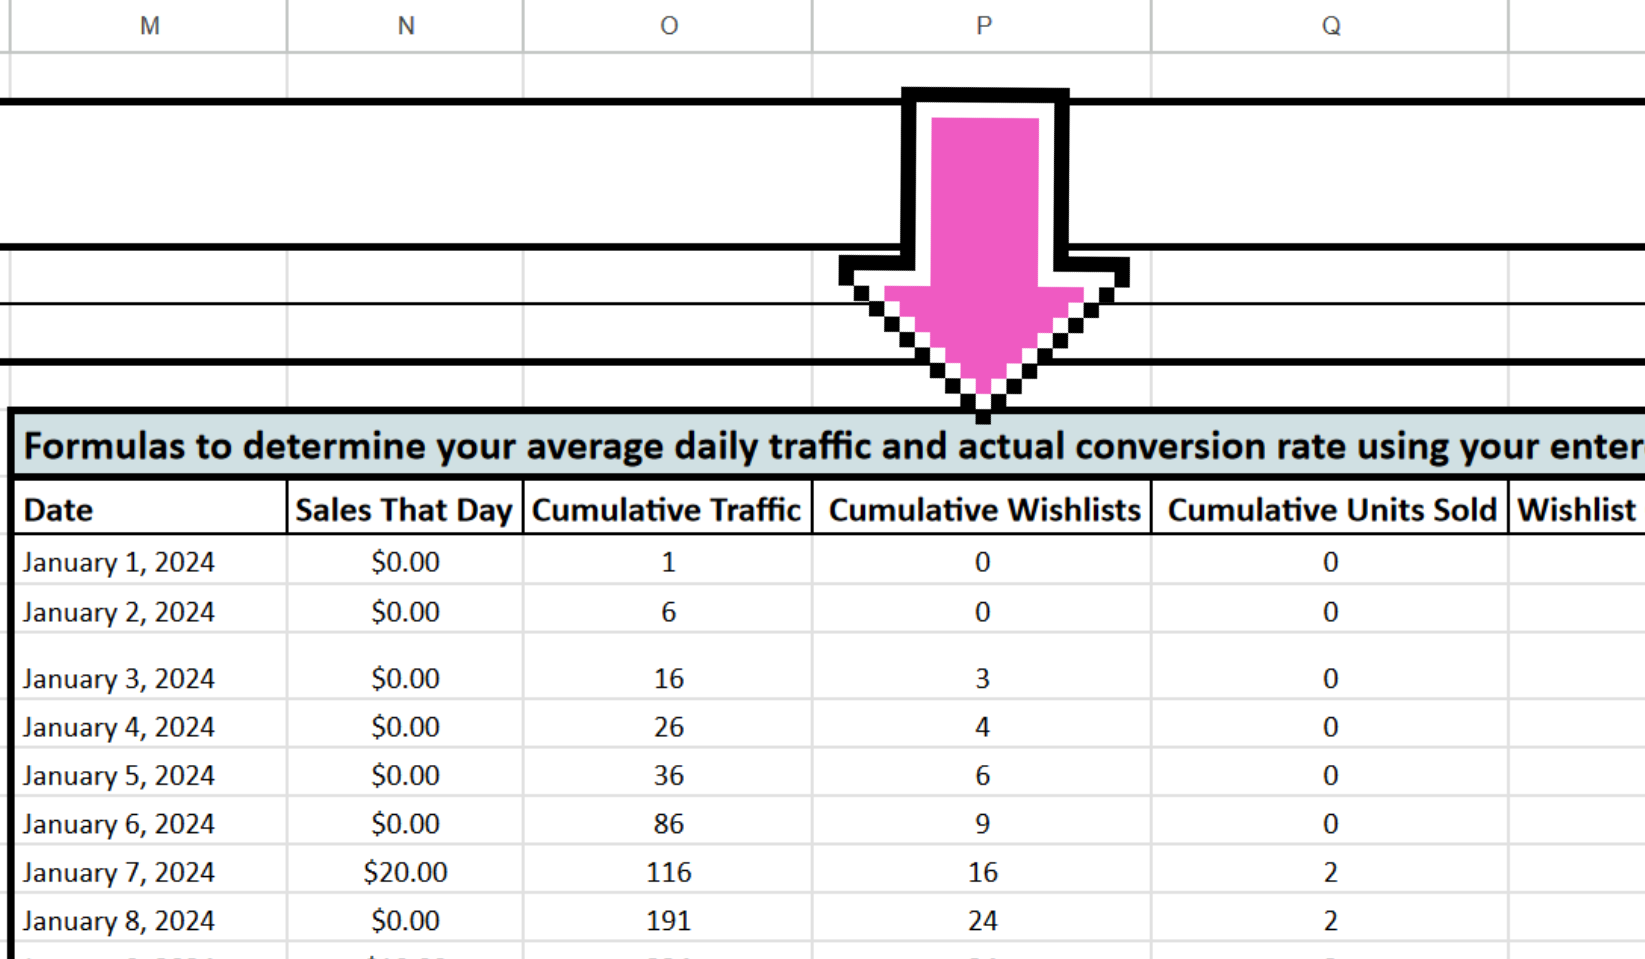
These are your cumulative wishlists up to a certain date.
Column Q10: Cumulative Units Sold
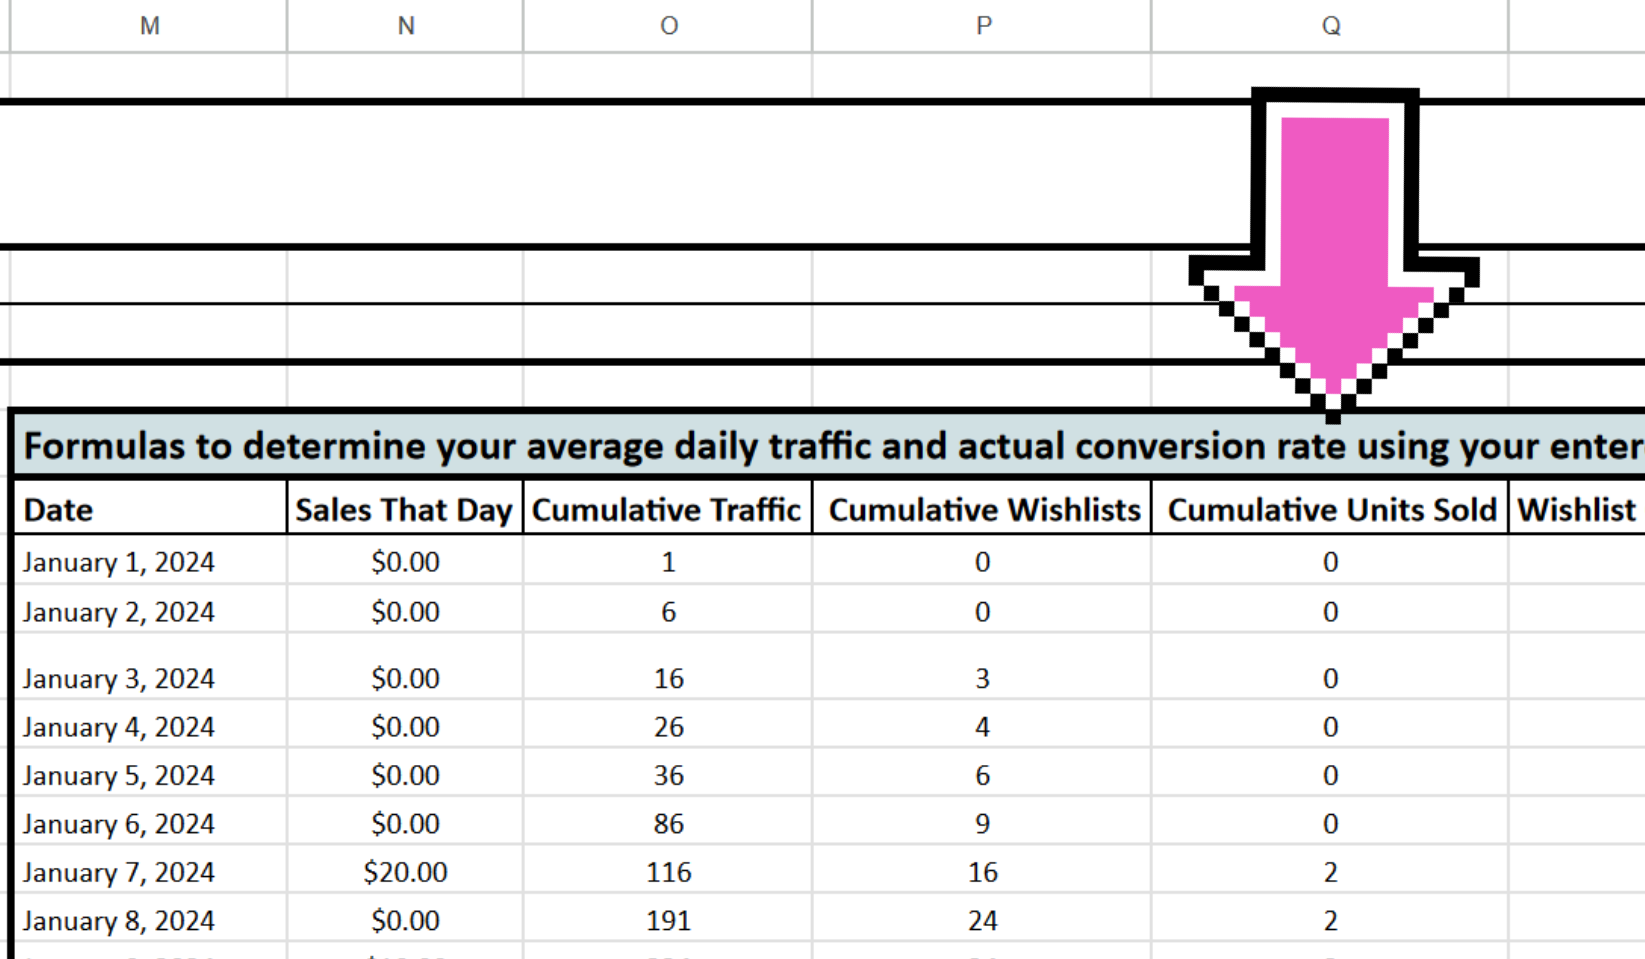
This is the cumulative number of units you've sold up to a certain date.
Column R10: Wishlist Conversion Rate
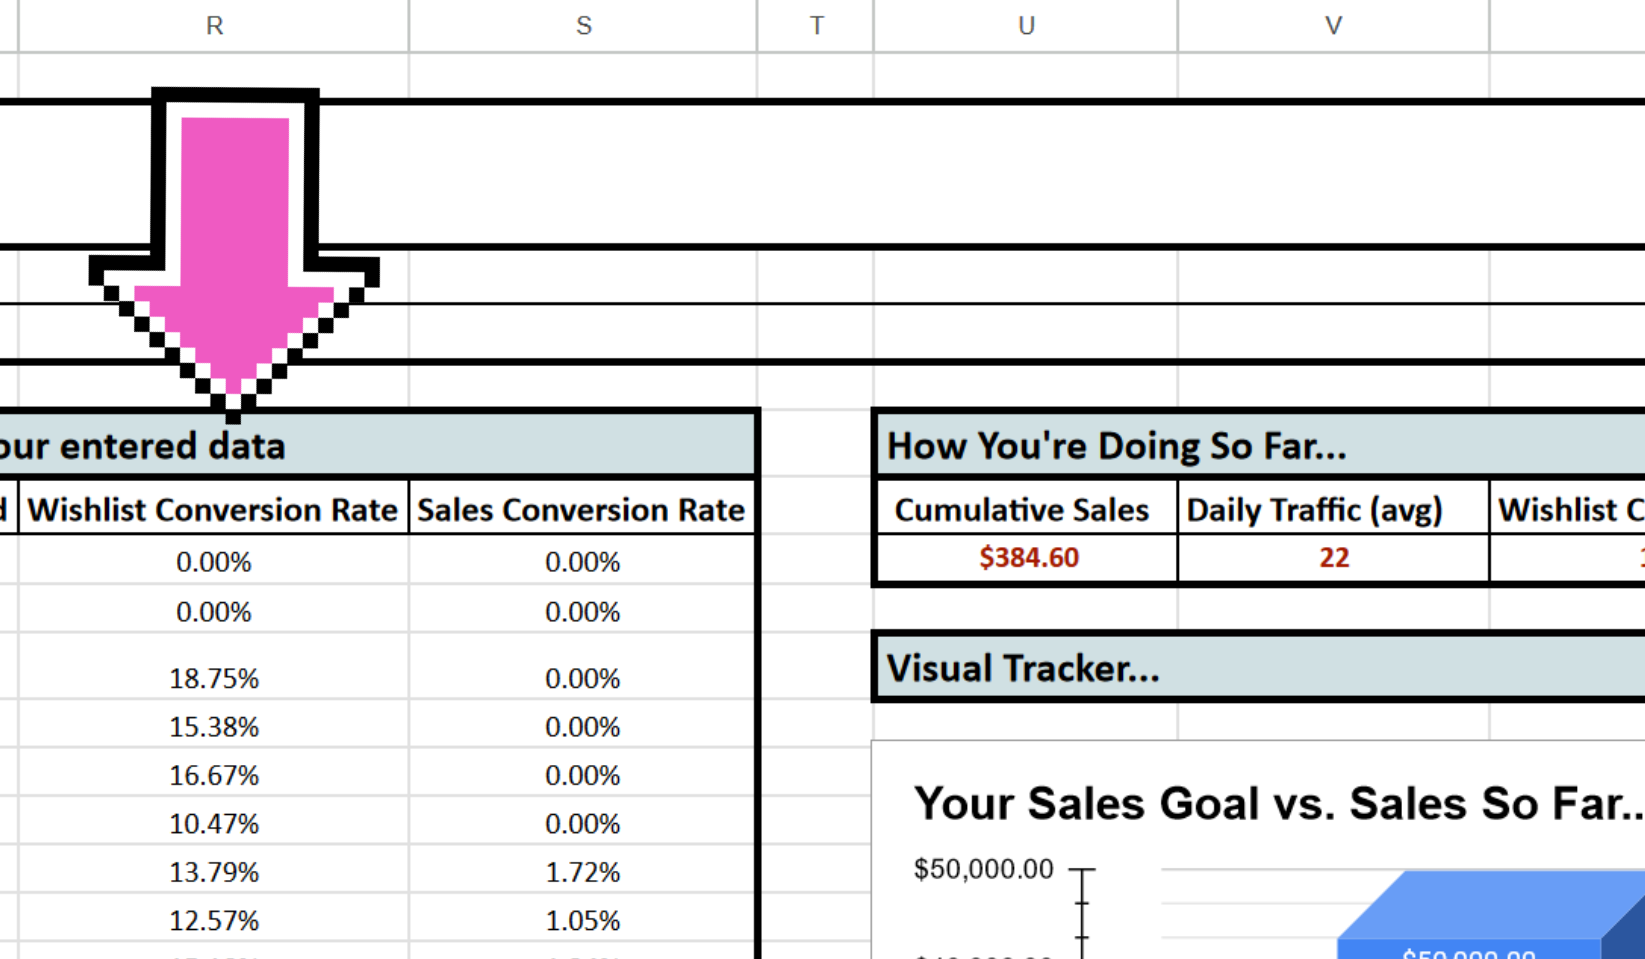
This is your actual wishlist conversion rate for that day.
Column S10: Sales Conversion Rate
This is your actual sales conversion rate for that day.
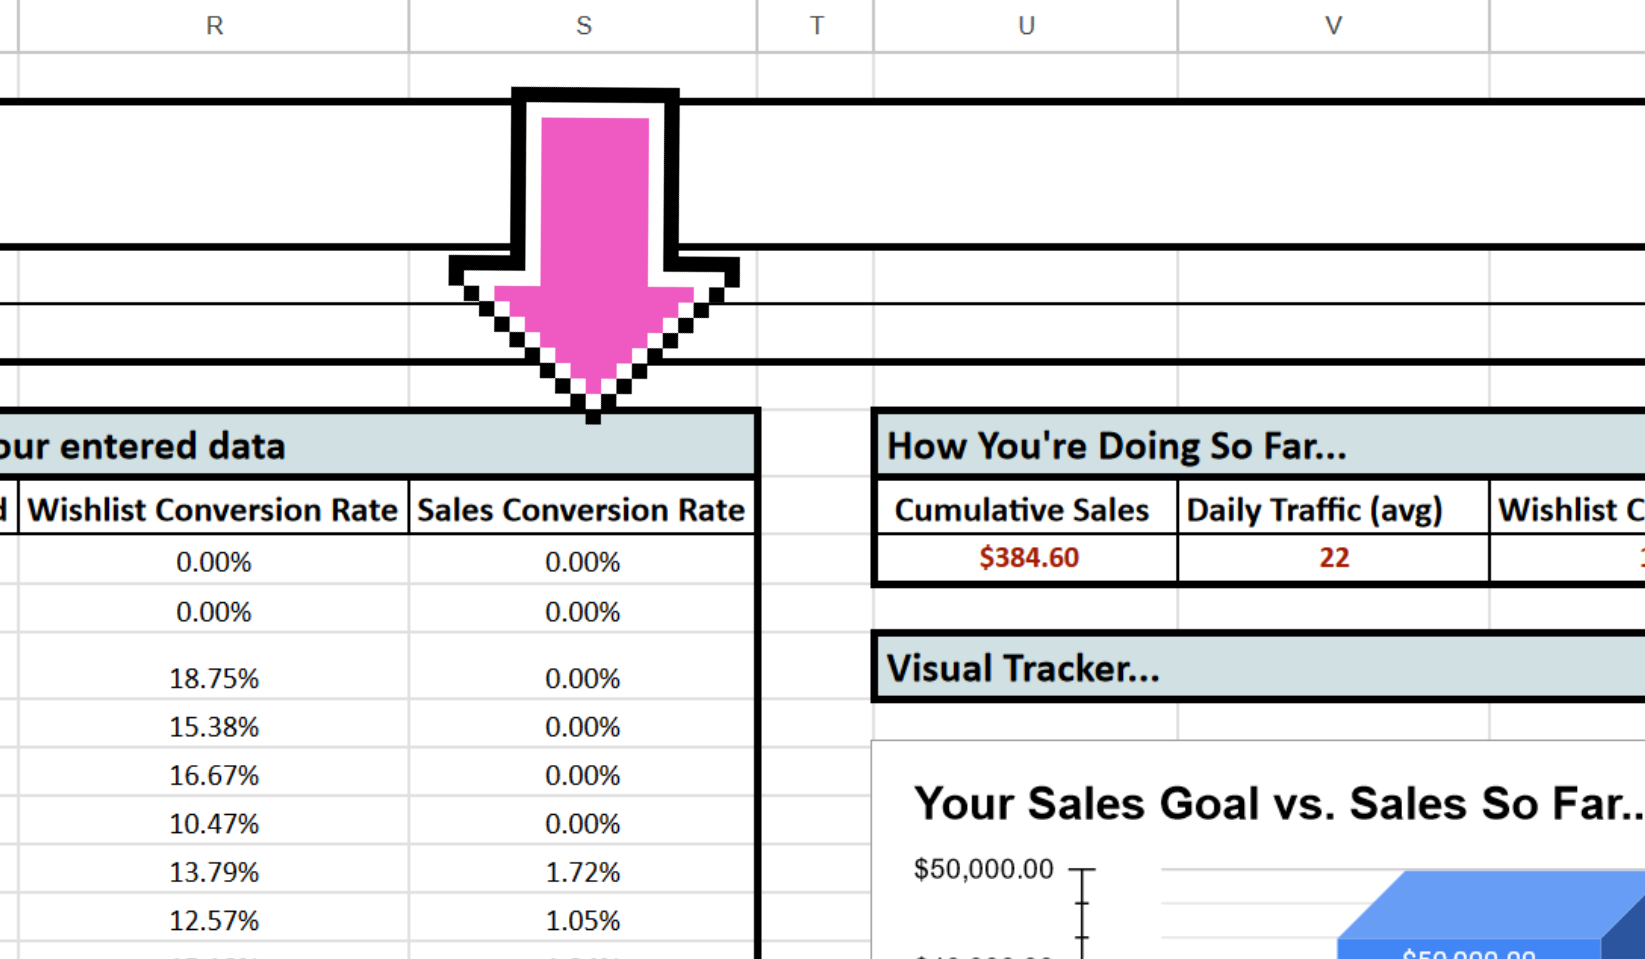
Ok, now to sum everything up in one little spot...
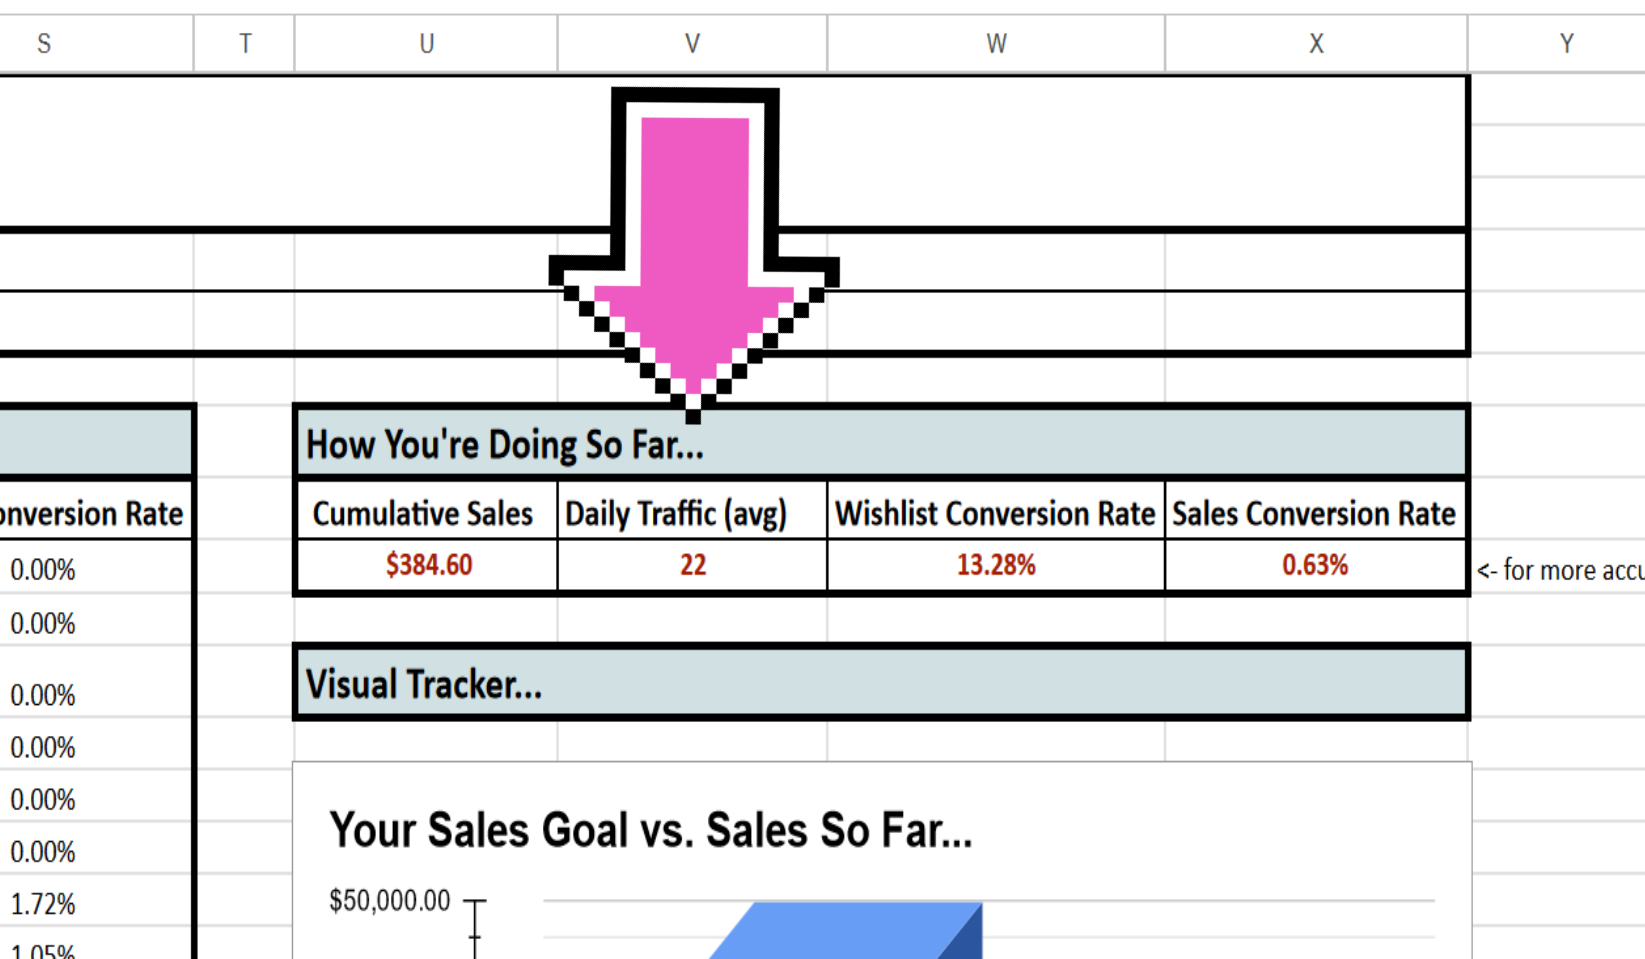
Cell U10: Cumulative Sales
Here are your cumulative sales so far, right now.
Cell V10: Daily Traffic (avg)
Here's how much on average daily traffic you're getting. I take the sum of your daily traffic (cell C10) and divide it by 365 days in a year.
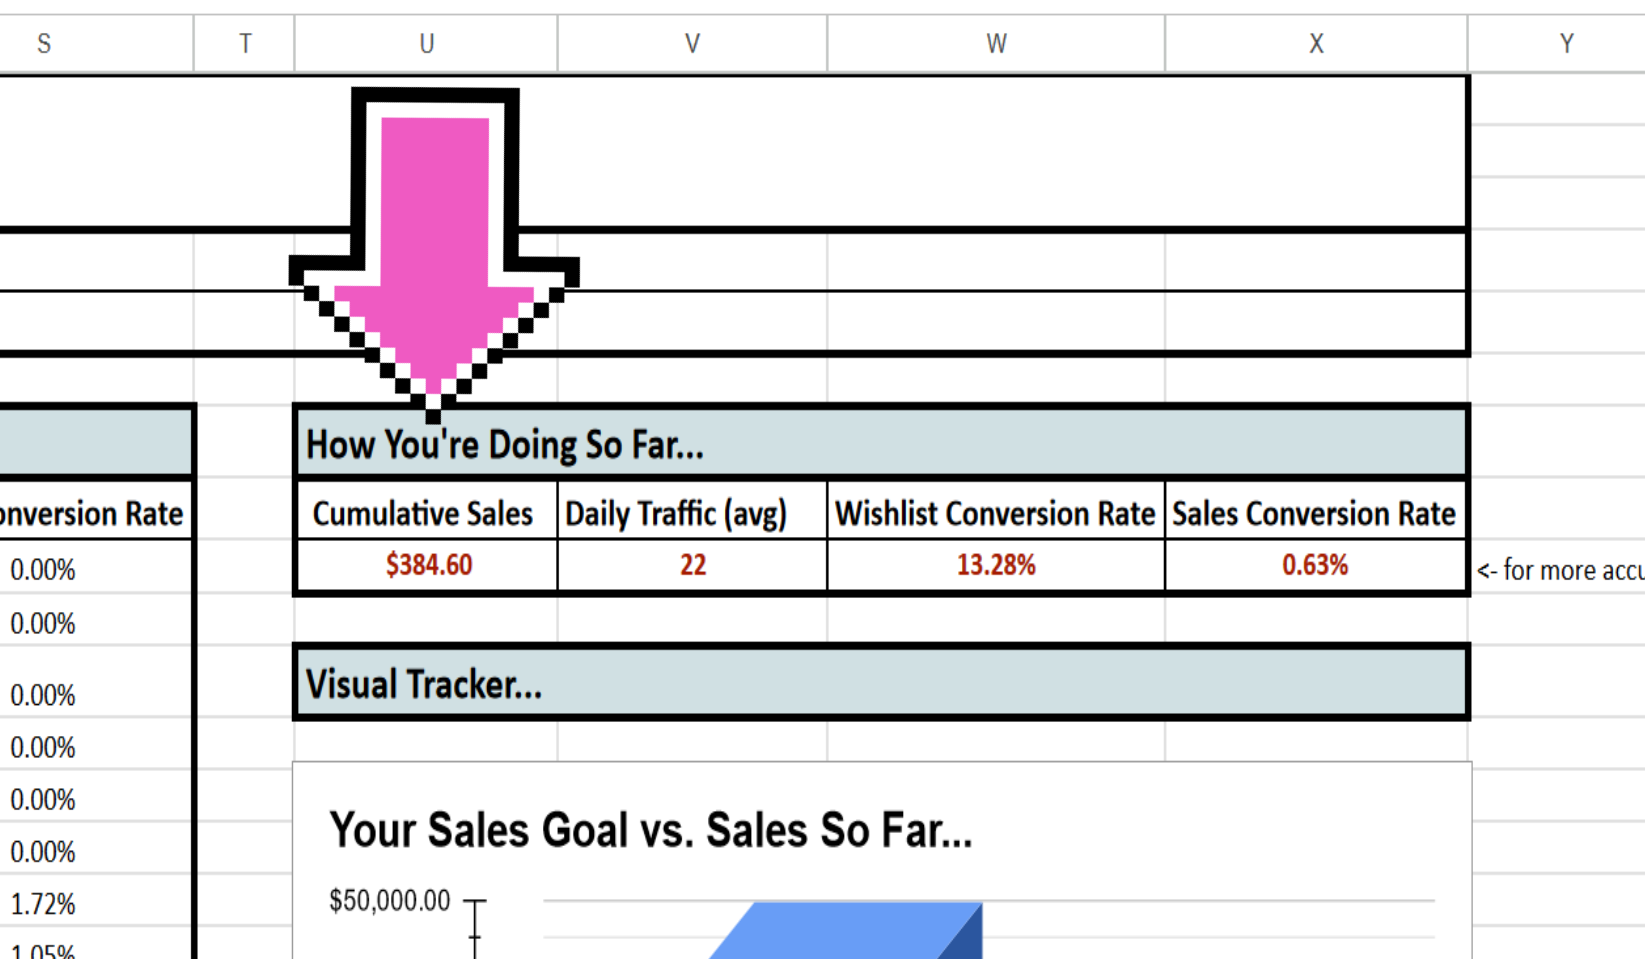
Cell W10: Wishlist Conversion Rate (avg)
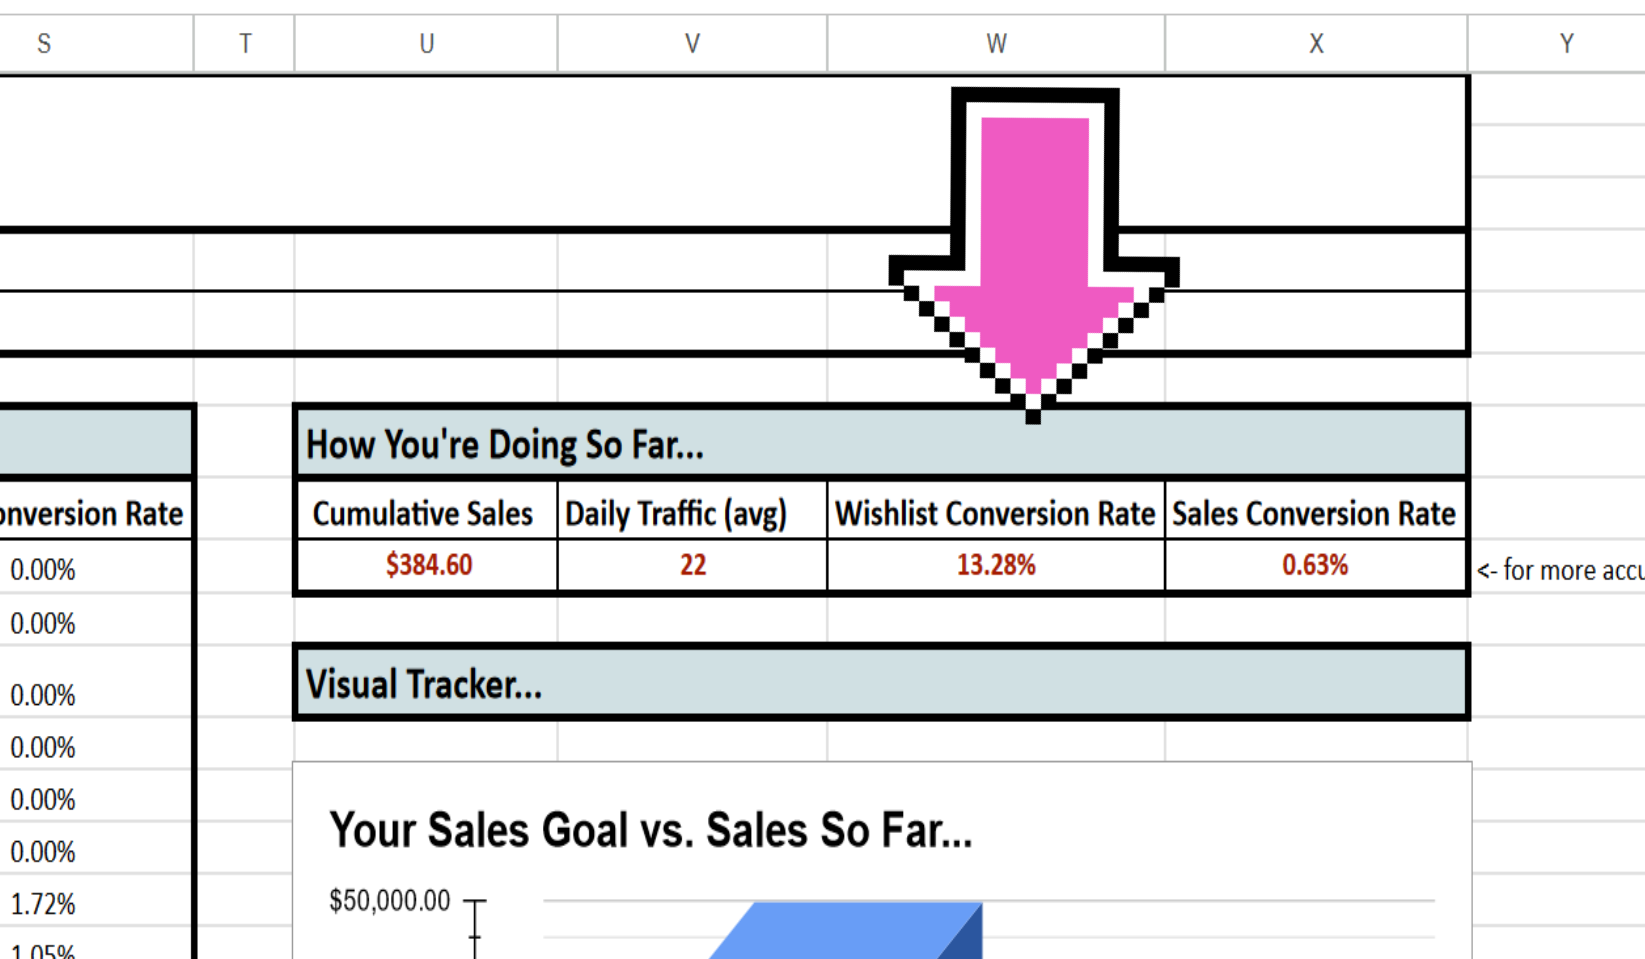
Here is your actual wishlist conversion rate so far, in one spot.
Cell X10: Sales Conversion Rate (avg)
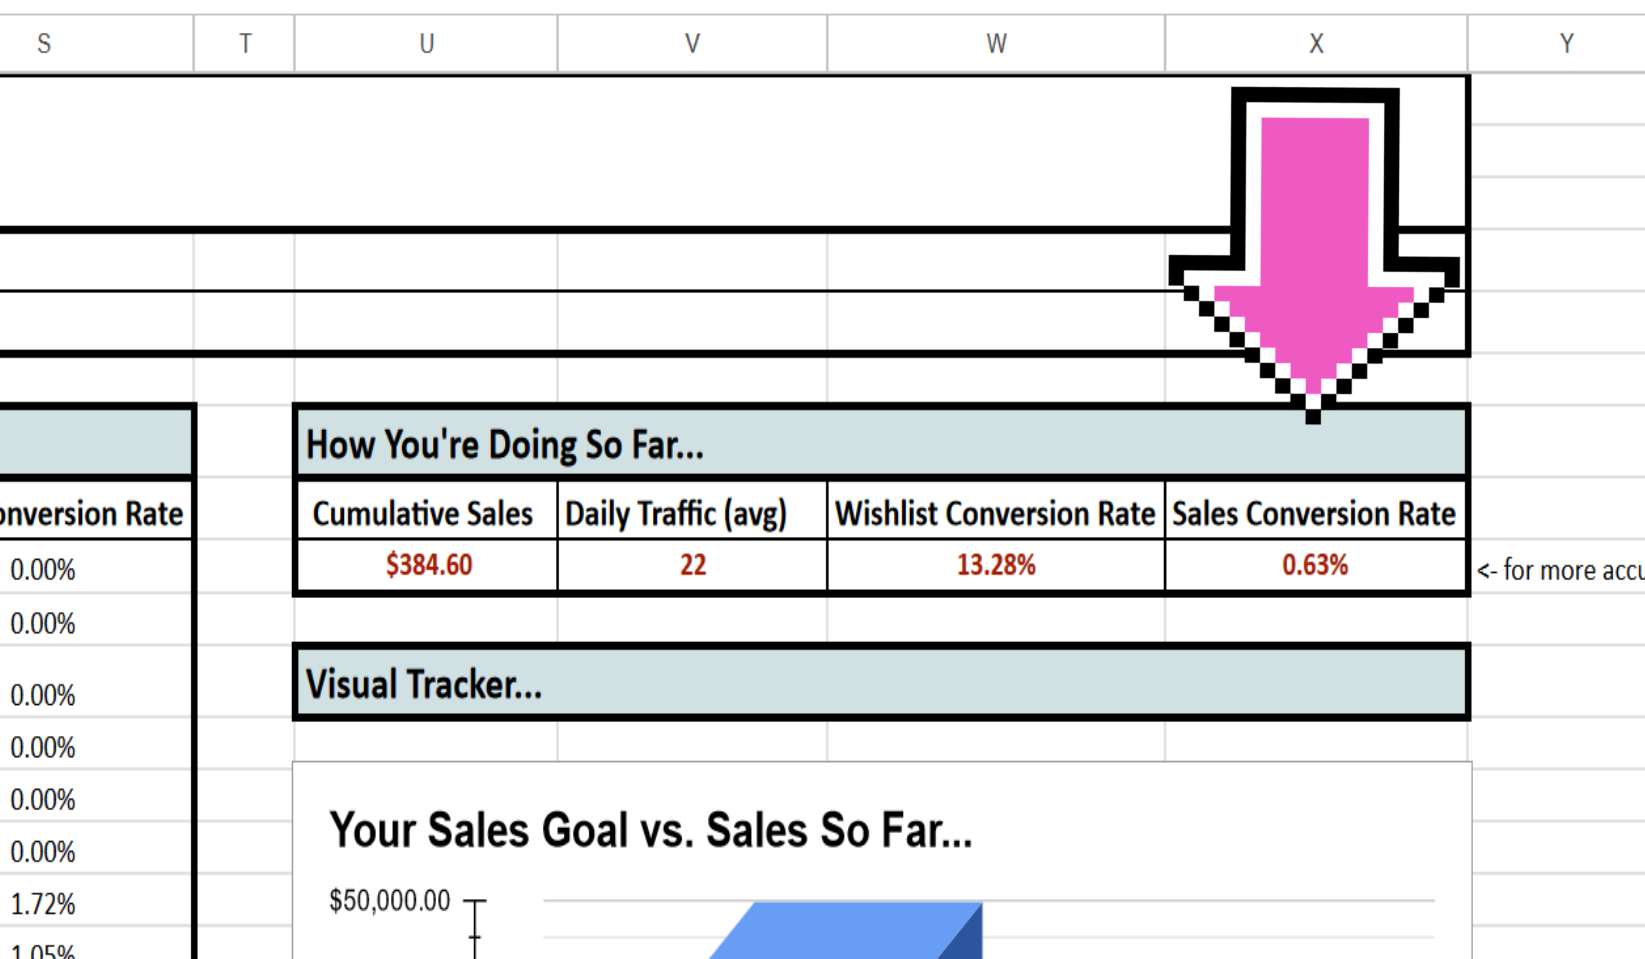
And here is your actual sales conversion rate so far, in one spot.
Also, I would highly recommend that you use this actual Sales Conversion Rate (Cell X10), and enter it in the Steam Traffic Formula tab in Cell C11. This will give you a more accurate idea on how you're actually doing.
To do this, copy and paste the following formula into cell C11 in the Steam Traffic Formula tab:
='Daily Conversion Tracker'!W10
(What you're doing here is grabbing the number from Cell X10 in the Daily Conversion Tracker tab, and dynamically plopping it in Cell C11 in the Steam Traffic Formula tab. This means you don't have to touch it, and it will automate dynamically as you update your Daily Conversion Tracker tab.)
Next...
Below, you'll notice three graphs. These graphs give you a visual representation of where you are so far in terms of your goals.
These are great because in less than one second you can see how you're doing and how much further you have to go to reach your goals.
Here's how the graphs work...
Your Sales Goal vs. Sales Far
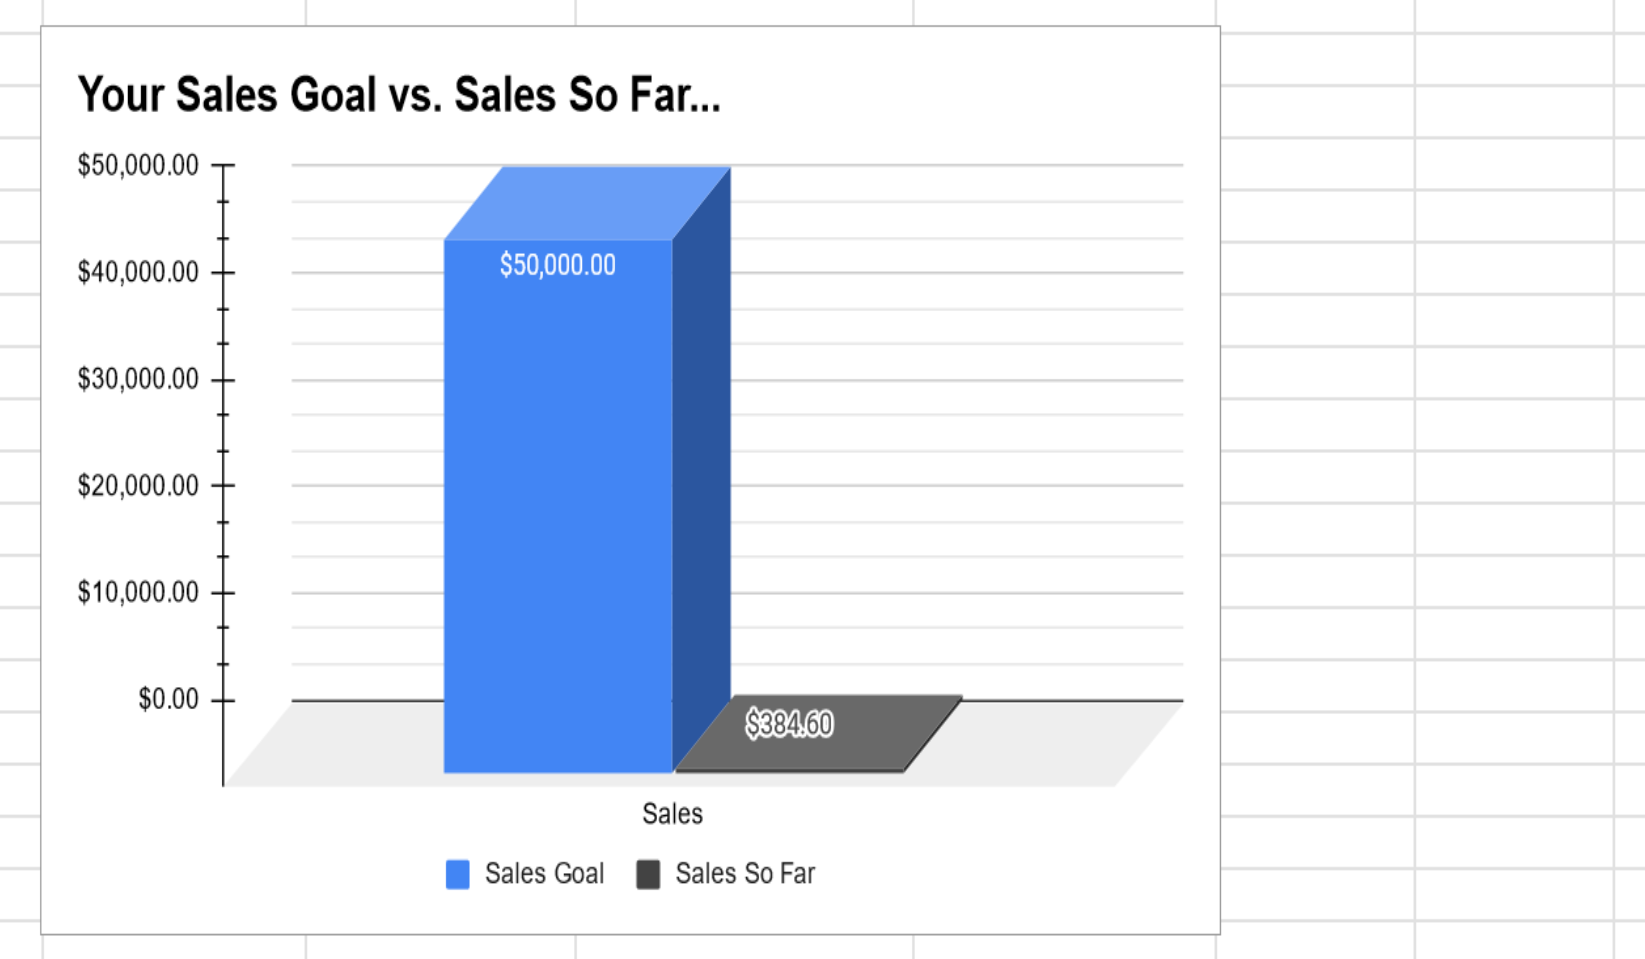
This graph shows you your financial goal and compares it to your sales so far. This will give you an idea of how much more you got to go!
Your Daily Traffic Goal vs. Actual Daily Traffic
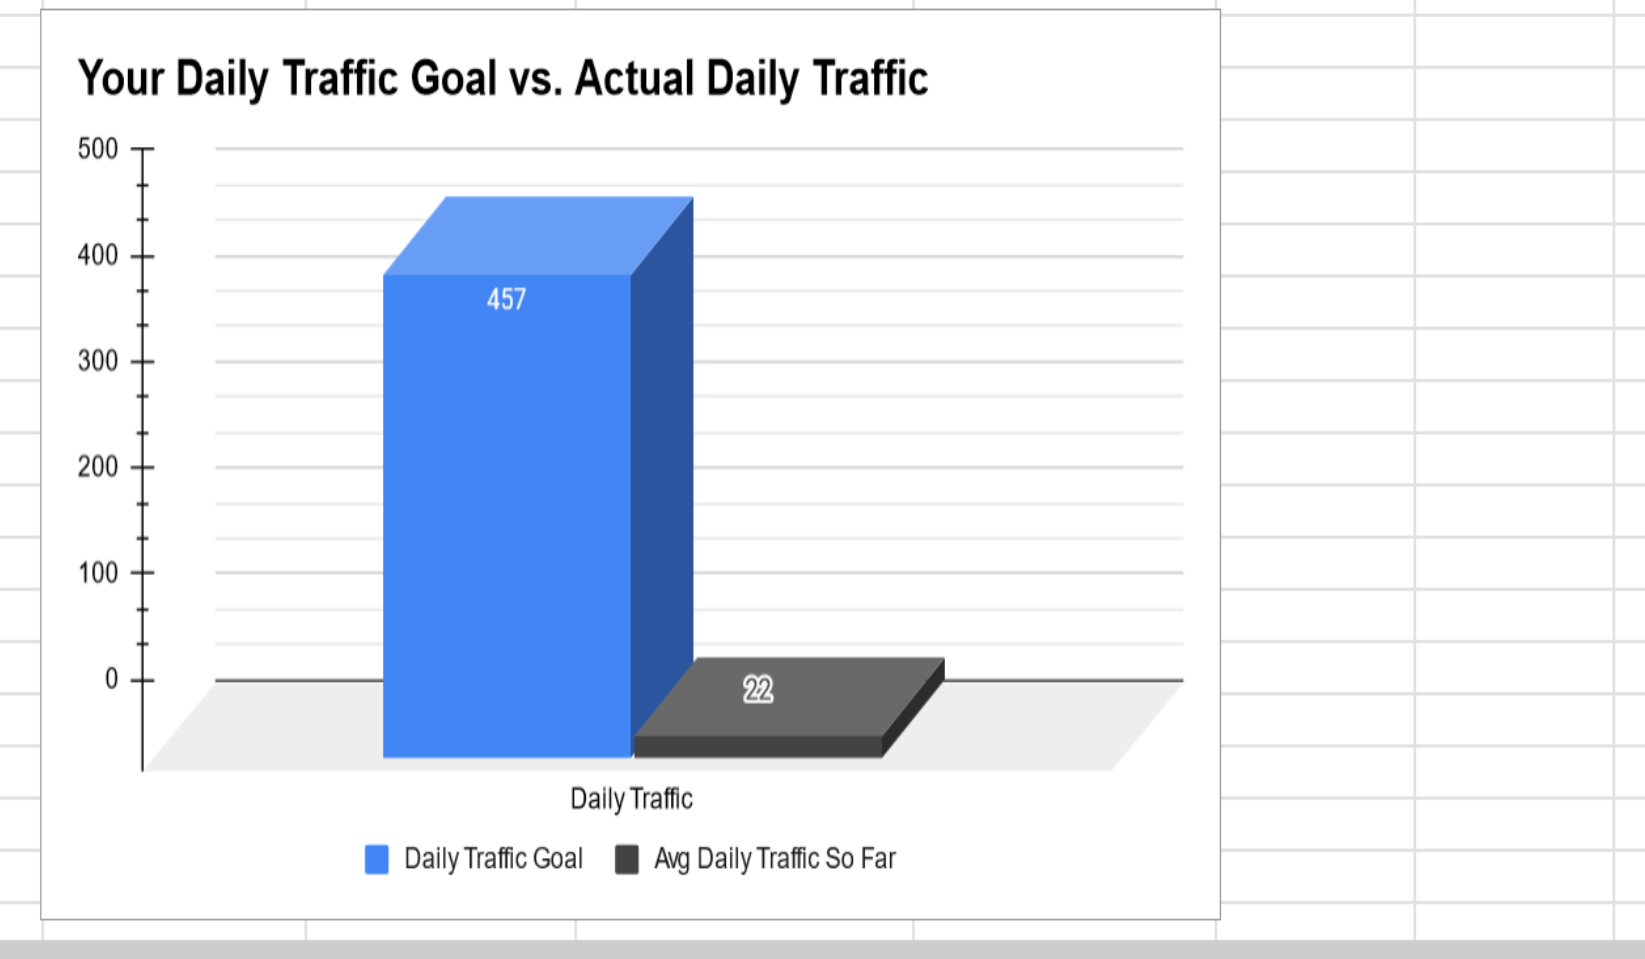
This graph shows you the target daily traffic you need in order to reach your financial goal -- and compares it with how much actual traffic you're getting so far.
3% Sales Conversion Rate vs. Actual Conversion Rate
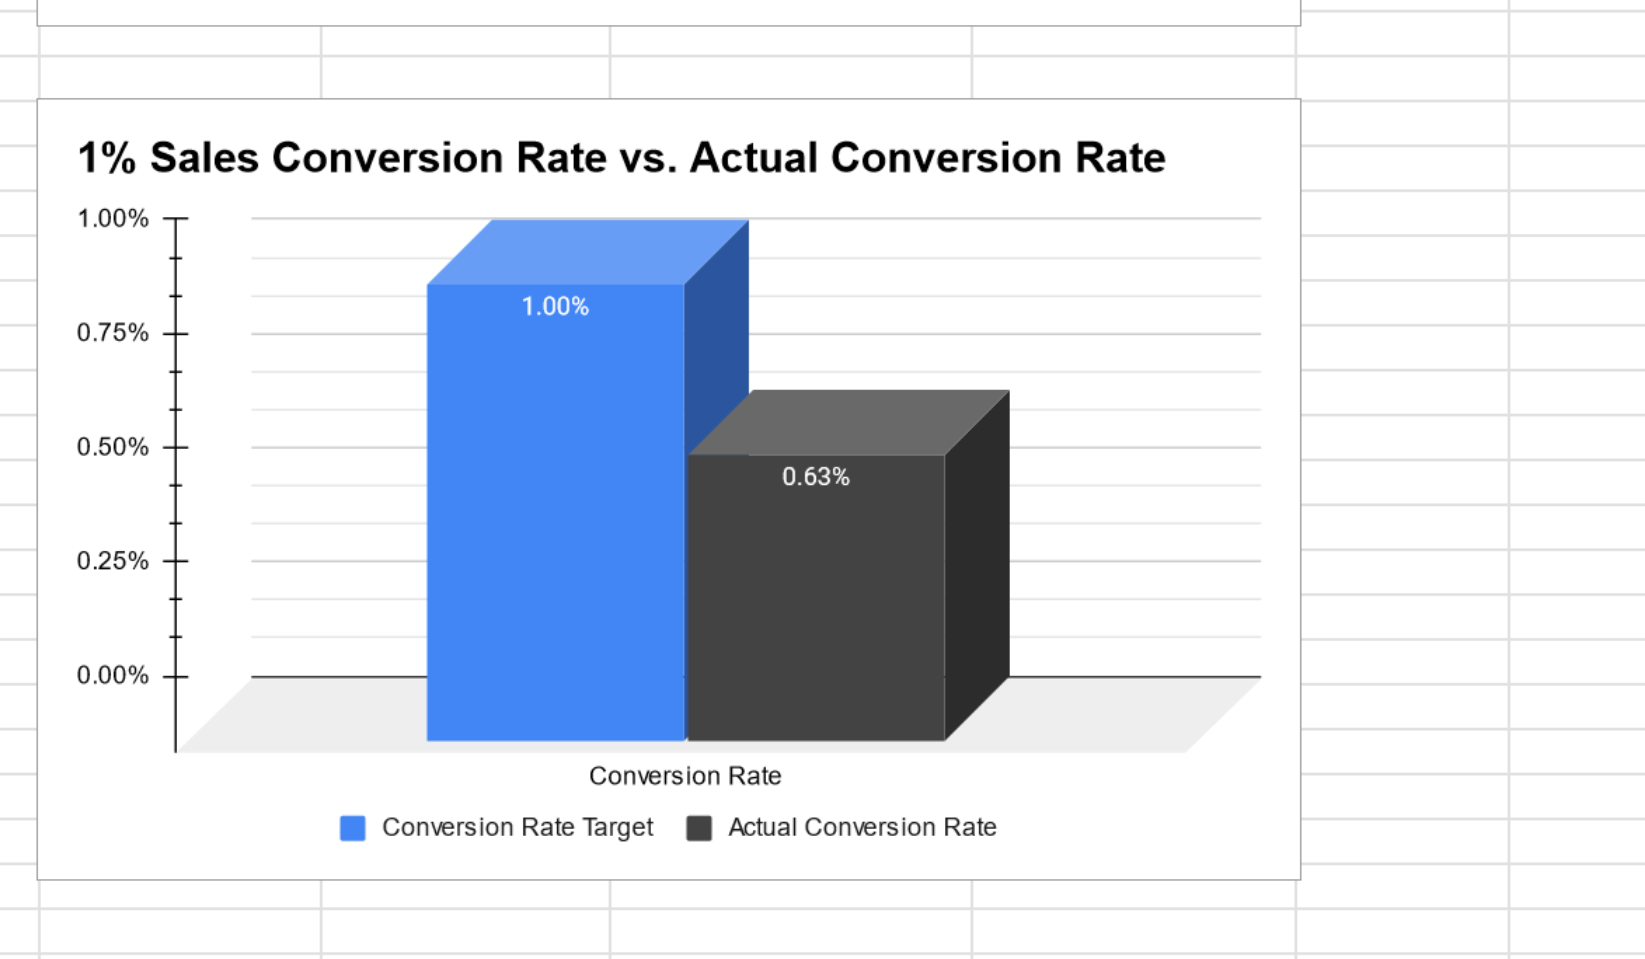
Remember, a 3% sales conversion rate is really good -- it's what you want to aim for. So this graph compares a 3% conversion rate to your actual conversion rate so far. Eg...
Points To Remember (Tab #3)
In this tab, I've noted down some important points to remember when testing and tracking.
I know through experience that I've stopped testing because the results I got were making NO sense. It felt like I was wasting time manually entering all this stuff. But I eventually learned that testing and tracking is an ongoing process, and you have to trust the system.
So let me share with you some insights I've learned:
"If you can't describe what you're doing as a process, you don't know what you're doing." - W. E. Deming
Most of this stuff I learned here came from Deming. He was a statistician who first developed sampling techniques used in the 1940's U.S Census. He was also a business expert, and helped Japan rebuild their economy after WWII. For instance, he helped companies like Sony dominate the electronics industry.
Anyway, here are a few points to remember when testing and tracking so that you don't get discouraged with your results:
- The plan? Set minimal simple conditions, run the system, watch results, refine after getting data, discover, test again
- For example you want to change your Steam's capsule art. But before you do, run and test the old capsule art. Track traffic and wishlists. Then change the capsule, and run the system again, track traffic and wishlists. Compare the old capsule art vs the new and see who the winner is. But remember...
- There will be variables you can't track or foresee
- Long-term and short-term results are often very different
- Keep in mind that results might be delayed
- Even the smallest changes in testing have side effects
- Track these results visually (because numbers in a spreadsheet don't really show the whole picture)
- Need to track results over time (never-ending continuous improvement)
- Need to look for unintended consequences and expect them
- Assume there will be problems that you never would consider
- Focus on what's working and develop that (i.e find the activity that gets you 80% of the results and focus on that)
- Search for bottlenecks and constraints (sometimes what you think is working can often be what is halting things)
Tips On Getting Better Conversion
One more little pointer...
It's a lot easier to increase conversion rates than it is to get more traffic.
In other words, it's a lot easier to raise your conversion from 1% to 3% than it is to increase traffic from 100 to 300.
In fact, the more traffic you get, the lower your conversion. Why? Because sometimes the quality of your traffic goes down.
For example, who cares if you get 10,000 players to visit your Steam page if they're not a fan of your genre. It's better to find 1,000 fans of your genre.
Why?
Because if you focus on the quality of your traffic, then this will naturally help you increase your conversion. That's because you're not trying to "sell" your game. You're not trying to convince a non-fan to buy your game. If you can attract people who are fans of your genre, then you have to do less "selling".
Of course, if you're a AAA company that already has a large customer base, and you can spend millions on branding, then traffic numbers matter. But if you're new studio with a small customer base, then you need to focus on the quality of your traffic, not quantity.
Ok, next...
Why Does Testing And Tracking Work...
Remember, the idea here is if you want your game studio to grow, you need to track what you do so that you can figure out what's working or not.
You want to discover ways you can optimize your time. For example, if YouTube brings in 80% of your traffic, then is it worth your time to post on Twitter... and make TikTok videos... and post on your blog? Maybe put all your efforts into what is working, and let go what is not. You only have so much time in the day.
Remember, you want to discover that activity that nets you 80% of the results. You don't want to spend 80% of your efforts on an activity that nets you only 20% of the results.
So use the Steam Traffic Formula and the Daily Conversion Tracker to create a "business system" -- so that you can discover those activities that give you 80% of your results.
Do this so you can optimize your marketing efforts and find the activities that increase your traffic and conversion rate.
And... when you first start your game company, you might be able to keep all this data in your head. But as your game studio grows, all this stuff you once kept in your brain needs to be put into a process that you can measure.
So start small. At least track your traffic, wishlists, sales, and conversion. You don't have to use my template. You can of course use yours.
But what's important is that you take your knowledge and assumptions and create a process you can test and measure. Sometimes what you think is going on is not what is going on -- because success is counter-intuitive.
So do this RIGHT NOW. Open the "Steam Traffic Formula" spreadsheet and find out your numbers.
Learning begins when you take action and it changes your behaviour. For example, I can spend 10,000 hours watching videos on how to shoot a 3-pointer... but I really never learned how to shoot. It's until I actually start shooting the ball that learning begins. That's because putting what you learn into action changes your behavior.
So do this IRL. Go to the Steam Page Formula template, and plug in your numbers. At least get an idea of how much daily traffic you need in order to reach your financial goals.
Start there. Then use my Daily Conversion Tracker to track your traffic, wishlists, sales, and conversions. Or setup your own. And don't forget to use Steam's tools:
Steam's UTM Analytics Tool
Steam's Traffic Reporting Tool
And most importantly: track your daily activities, actions, updates, change so you can see how they affect your stats. This is the most important part: watching how your actions and efforts directly affect your traffic, wishlists, sales, and conversion.
Do this because you'll discover insights that will help you come up with business strategies to help you increase your traffic and improve your conversions.
Need an affordable but professional website to help you attract potential players, streamers, or publishers?
Click the link below to find out what you get and how much...
Thanks for reading! Hope you got one insight to help you market your indie game and start growing your audience, and finding customers!

Dariusz Konrad
Email: dariusz at mainquestmarketing dot com
Discord Username: dariuszkonrad
LinkedIn: My entrepreneurial successes
Work: Game devs I've helped so far